
Beyond the Population Myth: The Real Drivers of Canada’s Housing Market
While population growth slows rather than shrinks, mid-range mortgage rates and qualifying stress tests emerge as the true catalysts reshaping home prices and affordability.
HIGHLIGHTS
Population Growth Decelerates, Avoiding Contraction: Data from Statistics Canada indicates that national population growth slowed to 0.46% (+189,425) year over year in Q3 2026, down from 2.85% (+1,139,889) in Q3 2024. Previous expectations of outright demographic contraction did not materialize, though growth rates have moderated significantly.
Ontario and BC See Sharp Growth Slowdown: Annual population growth in Ontario slowed to 0.28% (+45,160), while British Columbia decelerated to 0.14% (+8,054) year over year in Q3 2026. Alberta continues to outpace the national average with 1.52% population growth (+76,419) over the same timeframe.
Mortgage Rates and Stress Test Define Buying Power: Five-year fixed mortgage rates average near 4.70% and variable rates float near 4.00%, generating stress test qualification rates of 6.00% to 6.70%. This represents a significant shift from the 2.20% fixed rates seen during the 2021 pandemic trough, constraining household purchasing power.
Supply Growth Meets Evolving Demand: Completion of new residential housing has risk relative to the previous decade, increasing inventory in key urban centers. However, elevated borrowing costs remain the principal catalyst behind recent price adjustments in high-priced markets.
Central Bank Policy Focus: Bank of Canada officials have reiterated that the central bank’s monetary policy tools target overall inflation rather than setting specific targets for residential property prices.
Population Growth: Deceleration vs. Contraction
Data from Statistics Canada confirms that Canada’s population continued to expand through Q3 2026, putting to rest earlier narrative assumptions that falling rents and softening house prices were driven by a shrinking population.
| Province/Region | July 1, 2023 | July 1, 2024 | July 1, 2025 | July 1, 2026 | YoY % (2025-2026) |
|---|---|---|---|---|---|
| Canada | 40.02 M | 41.16 M | 41.61 M | 41.80 M | +0.46% |
| Ontario | 15.62 M | 16.09 M | 16.22 M | 16.26 M | +0.28% |
| British Columbia | 5.51 M | 5.66 M | 5.70 M | 5.71 M | +0.14% |
| Alberta | 4.69 M | 4.90 M | 5.02 M | 5.10 M | +1.52% |
| Quebec | 8.82 M | 8.98 M | 9.05 M | 9.07 M | +0.18% |
Between July 2023 and July 2024, Canada added 1,139,889 residents. Over the subsequent 12-month period ending July 2026, national growth moderated to 189,425 individuals.
Visualizing national population trajectory from 2022 to 2026.
While growth cooled significantly across Ontario and British Columbia, net annual demographic trends remain positive across all major provinces.
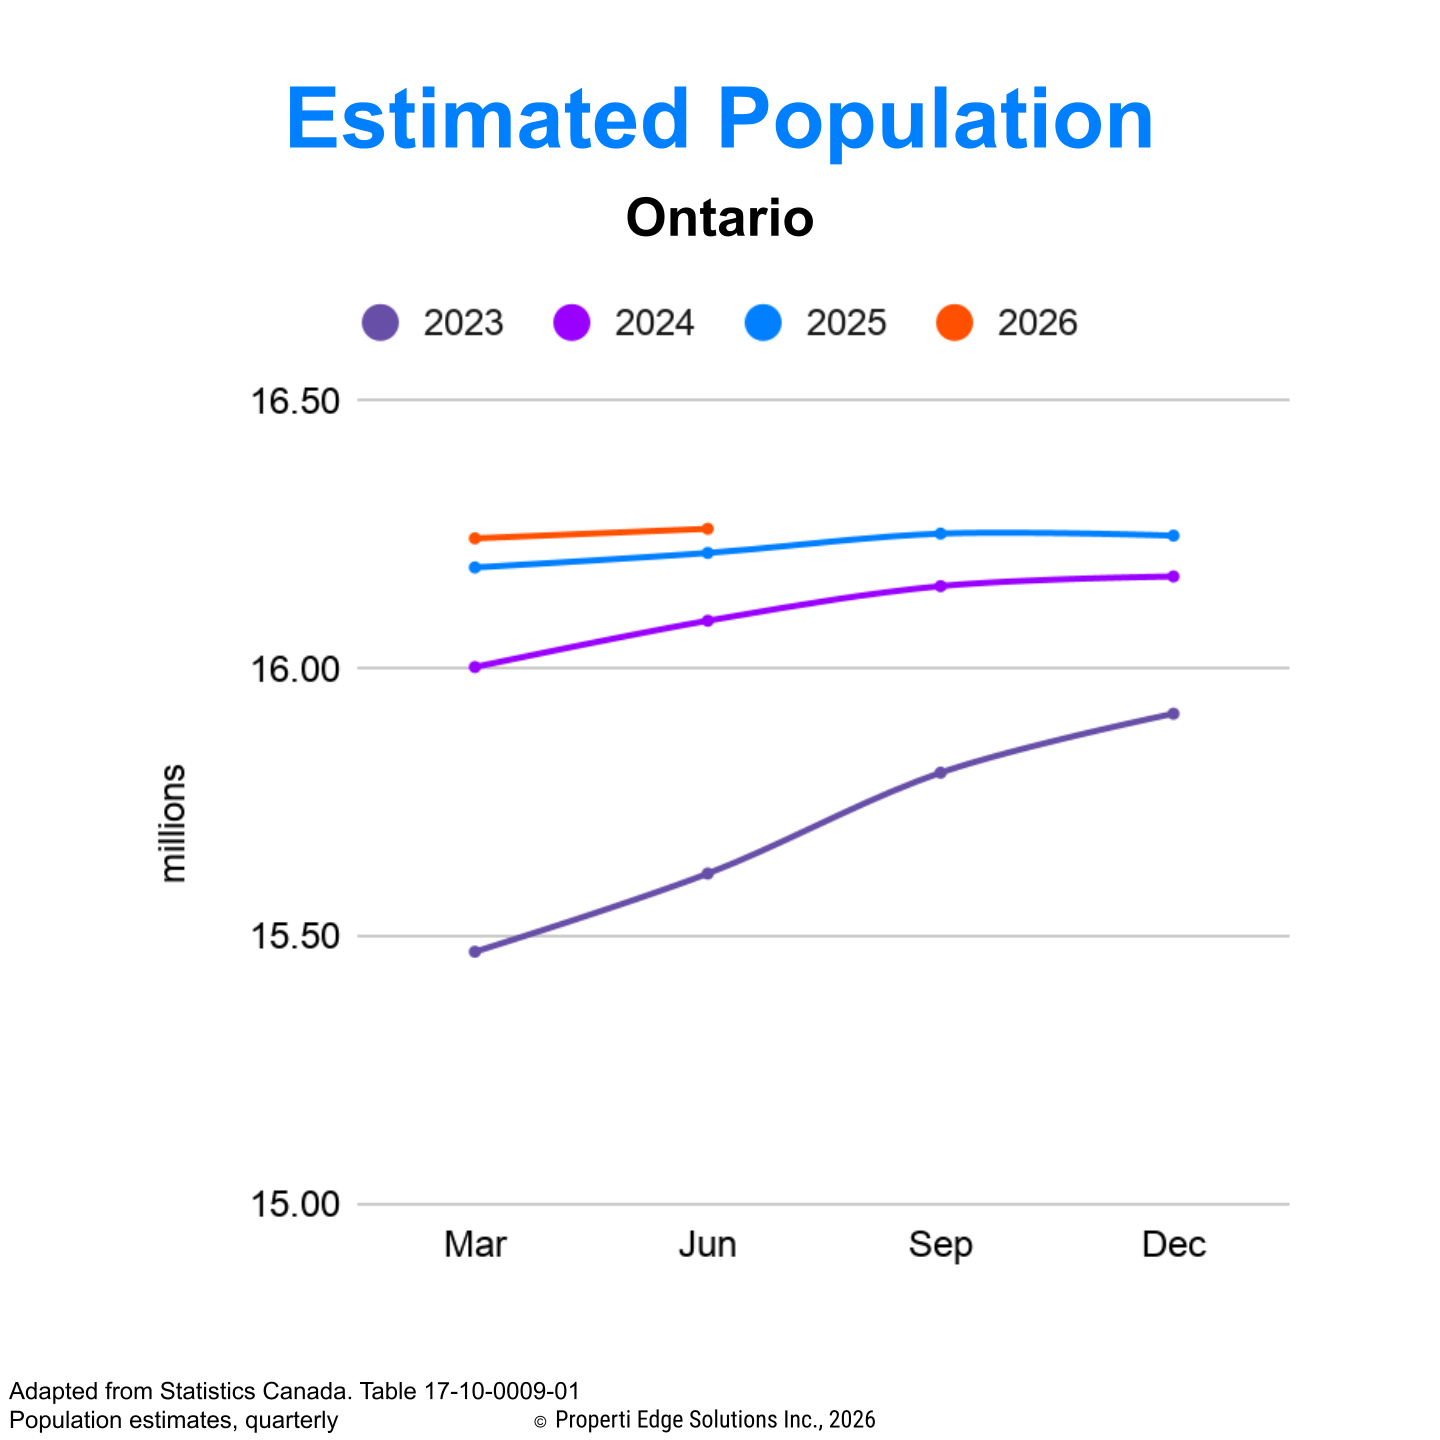
Visualizing Ontario population curve flattening through 2026.
Supply Dynamics and the Real Impact of Mortgage Rates
While residential building completions have reached higher volumes compared to the prior decade, increased supply alone does not fully account for recent real estate price recalibrations in major metropolitan centers.
The movement in housing valuations correlates directly with shifts in mortgage interest rates and credit availability:
Pandemic Lows (2020–2021): Five-year fixed rates hovered around 2.20% and variable rates near 1.70%, creating stress test qualification thresholds near 5.25%.
Cycle Highs (2023): Fixed rates peaked near 6.10% and variable rates near 7.20%, pushing stress test qualifying rates above 8.00% and drastically reducing buyer leverage.
Current Environment (Late 2026): Five-year fixed rates have stabilized near 4.70% and variable rates near 4.00%. While rates have dropped 1.40% to 3.20% from their recent peaks, fixed rates remain 2.1 times higher than 2021 levels.
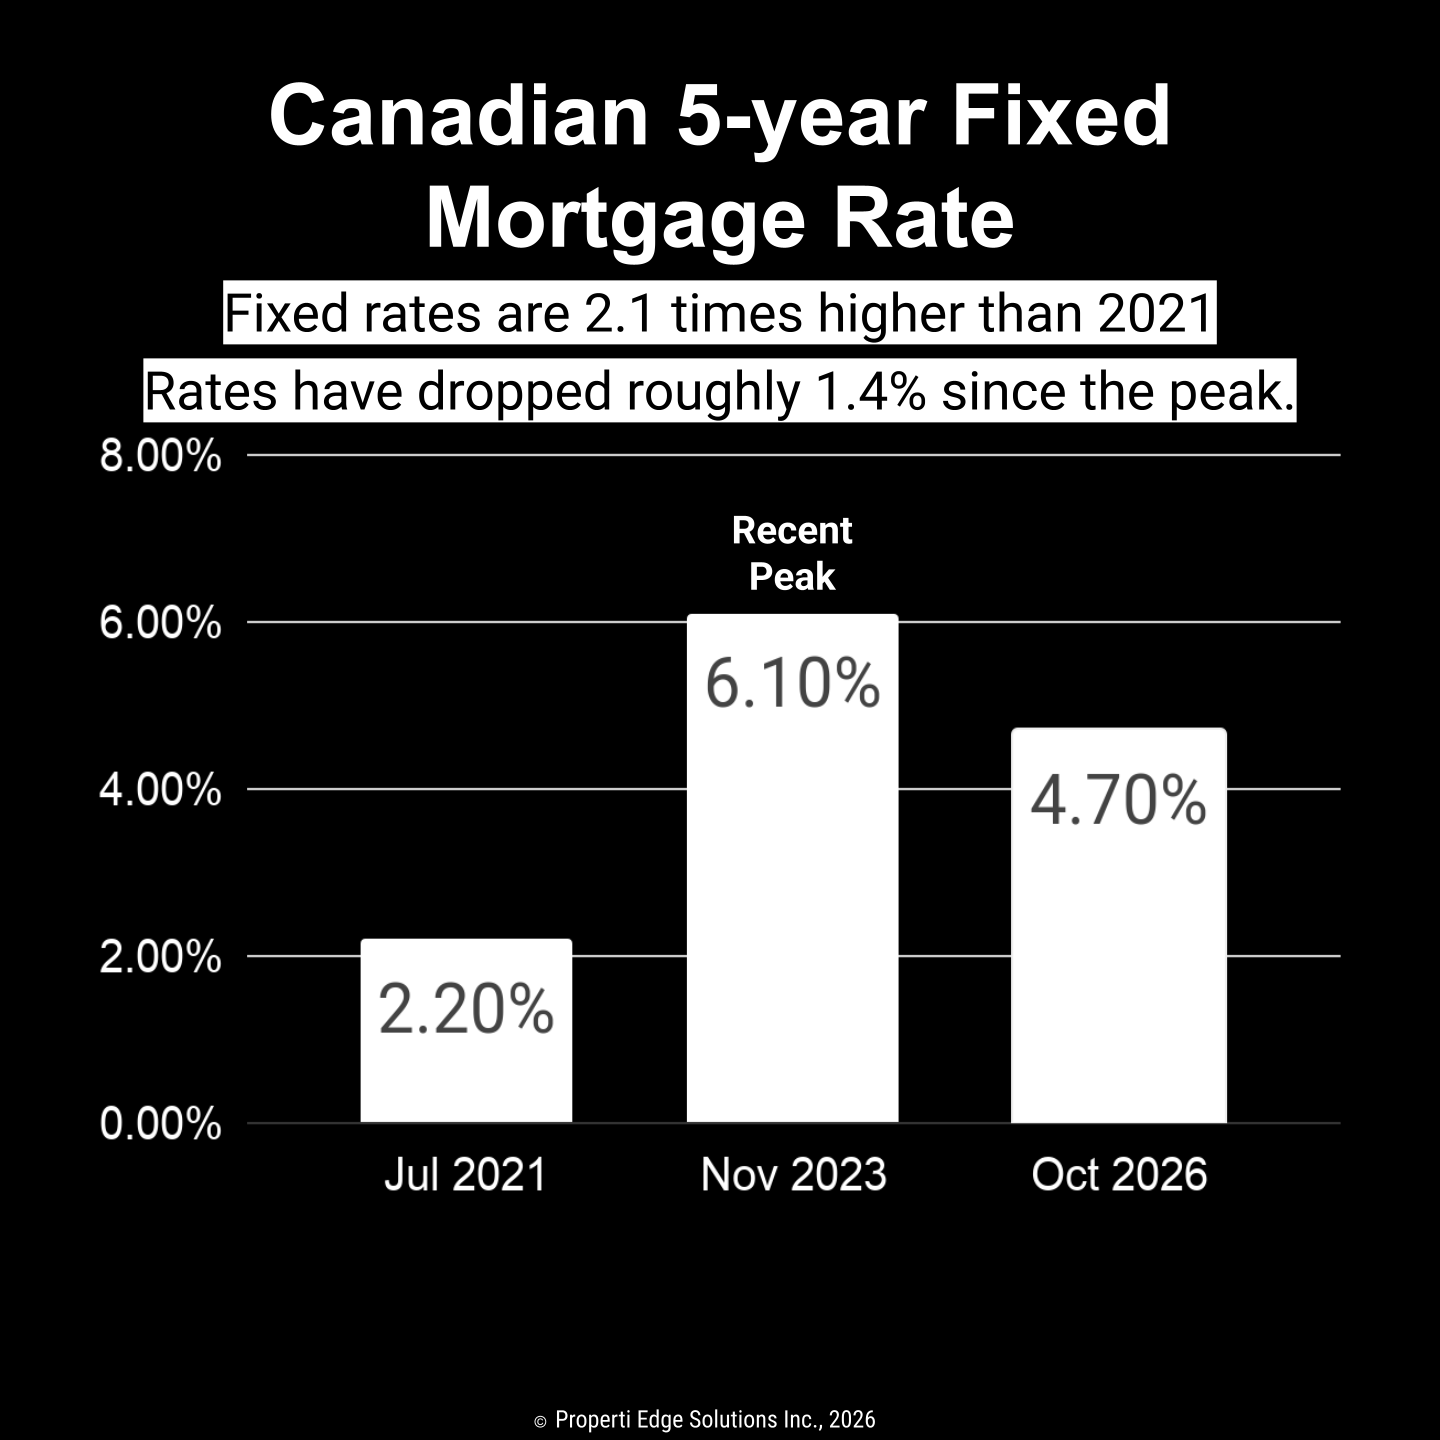
Comparing 2.20% in July 2021, 6.10% peak in Nov 2023, and 4.70% in Oct 2026.
Under current OSFI stress test requirements, buyers qualifying at a 6.70% benchmark face significantly tighter borrowing limits compared to the low-rate environment of 2020–2021, directly constraining home purchasing budgets. Those blaming the stress test for causing the correction in 2022, should note that the stress test was in place at the beginning of 2018 before the market reached the all time highs of 2021/22.
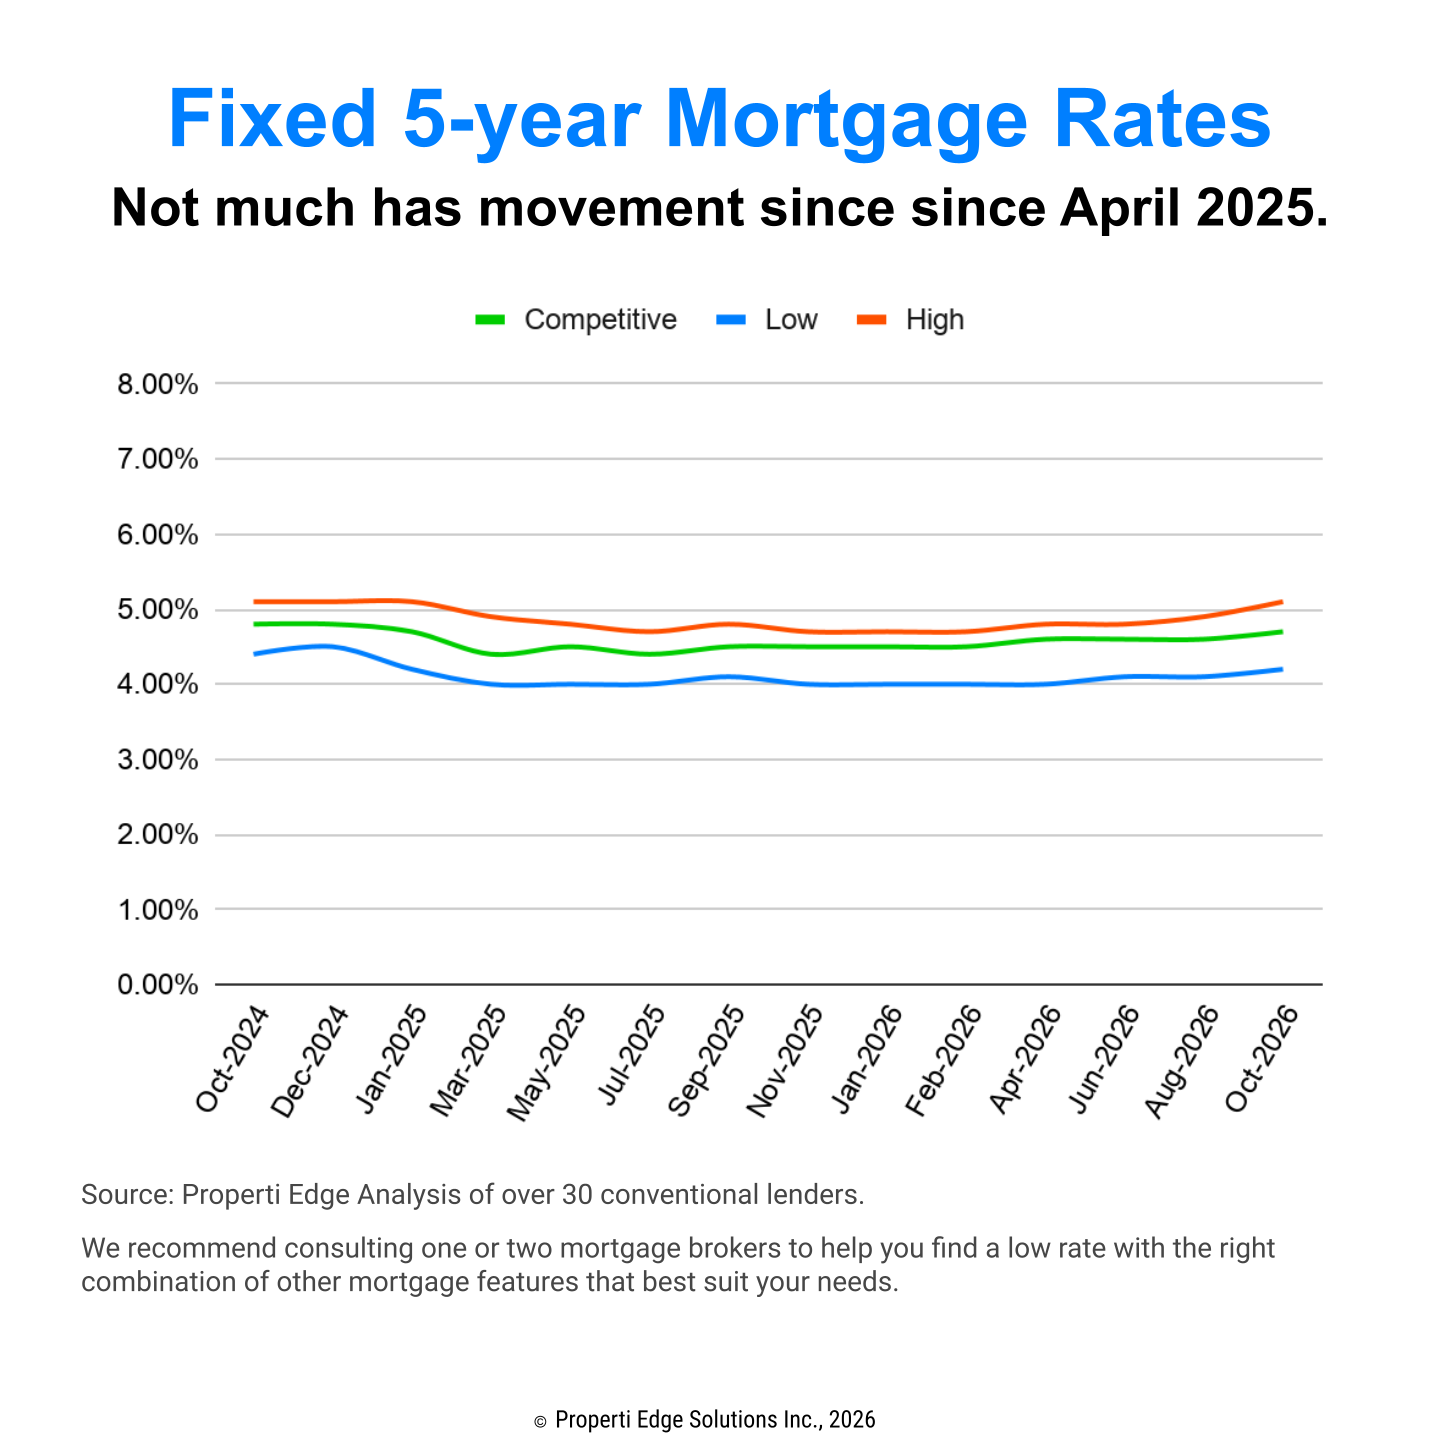
Tracking competitive, low, and high fixed rates across lenders from late 2024 through late 2026.
Employment Fundmentals and Bank of Canada Stance
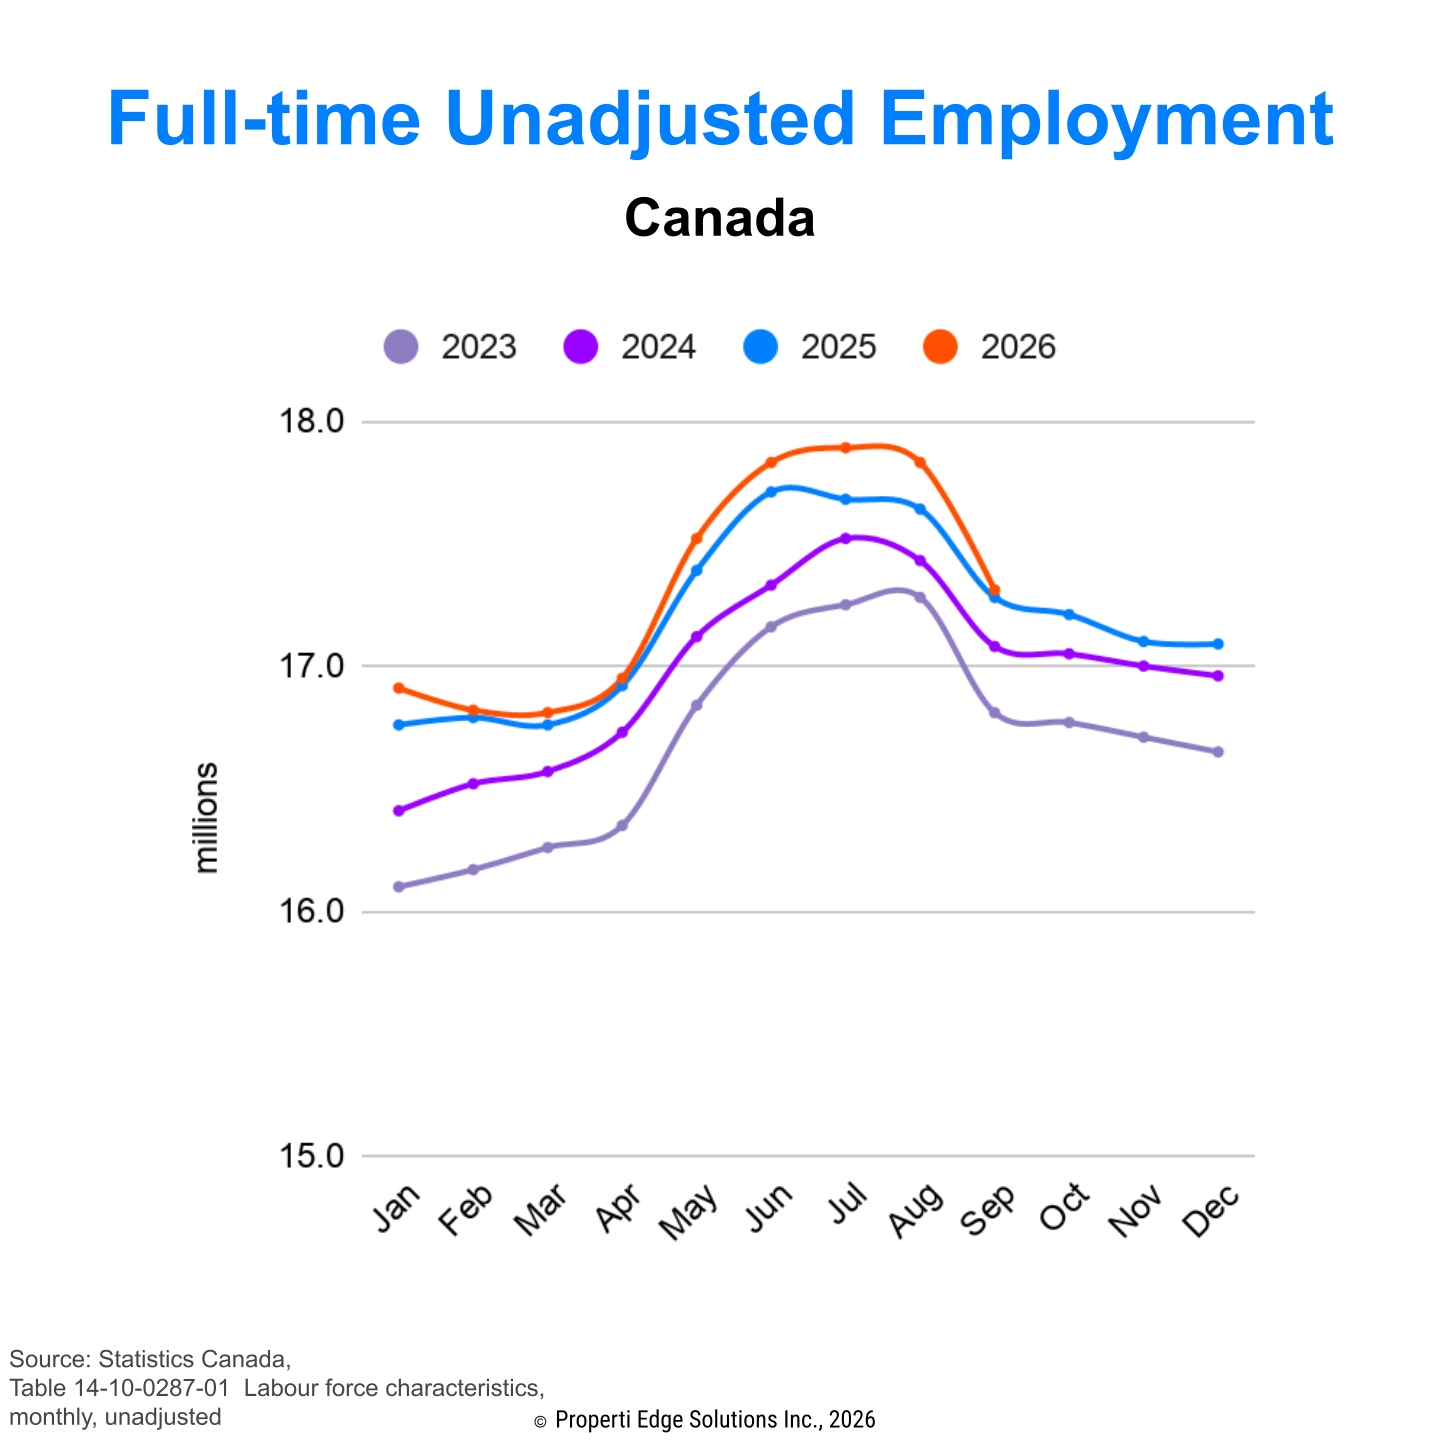
Despite shifting interest rates, national full-time employment has remained stable, continuing to support baseline economic capacity.
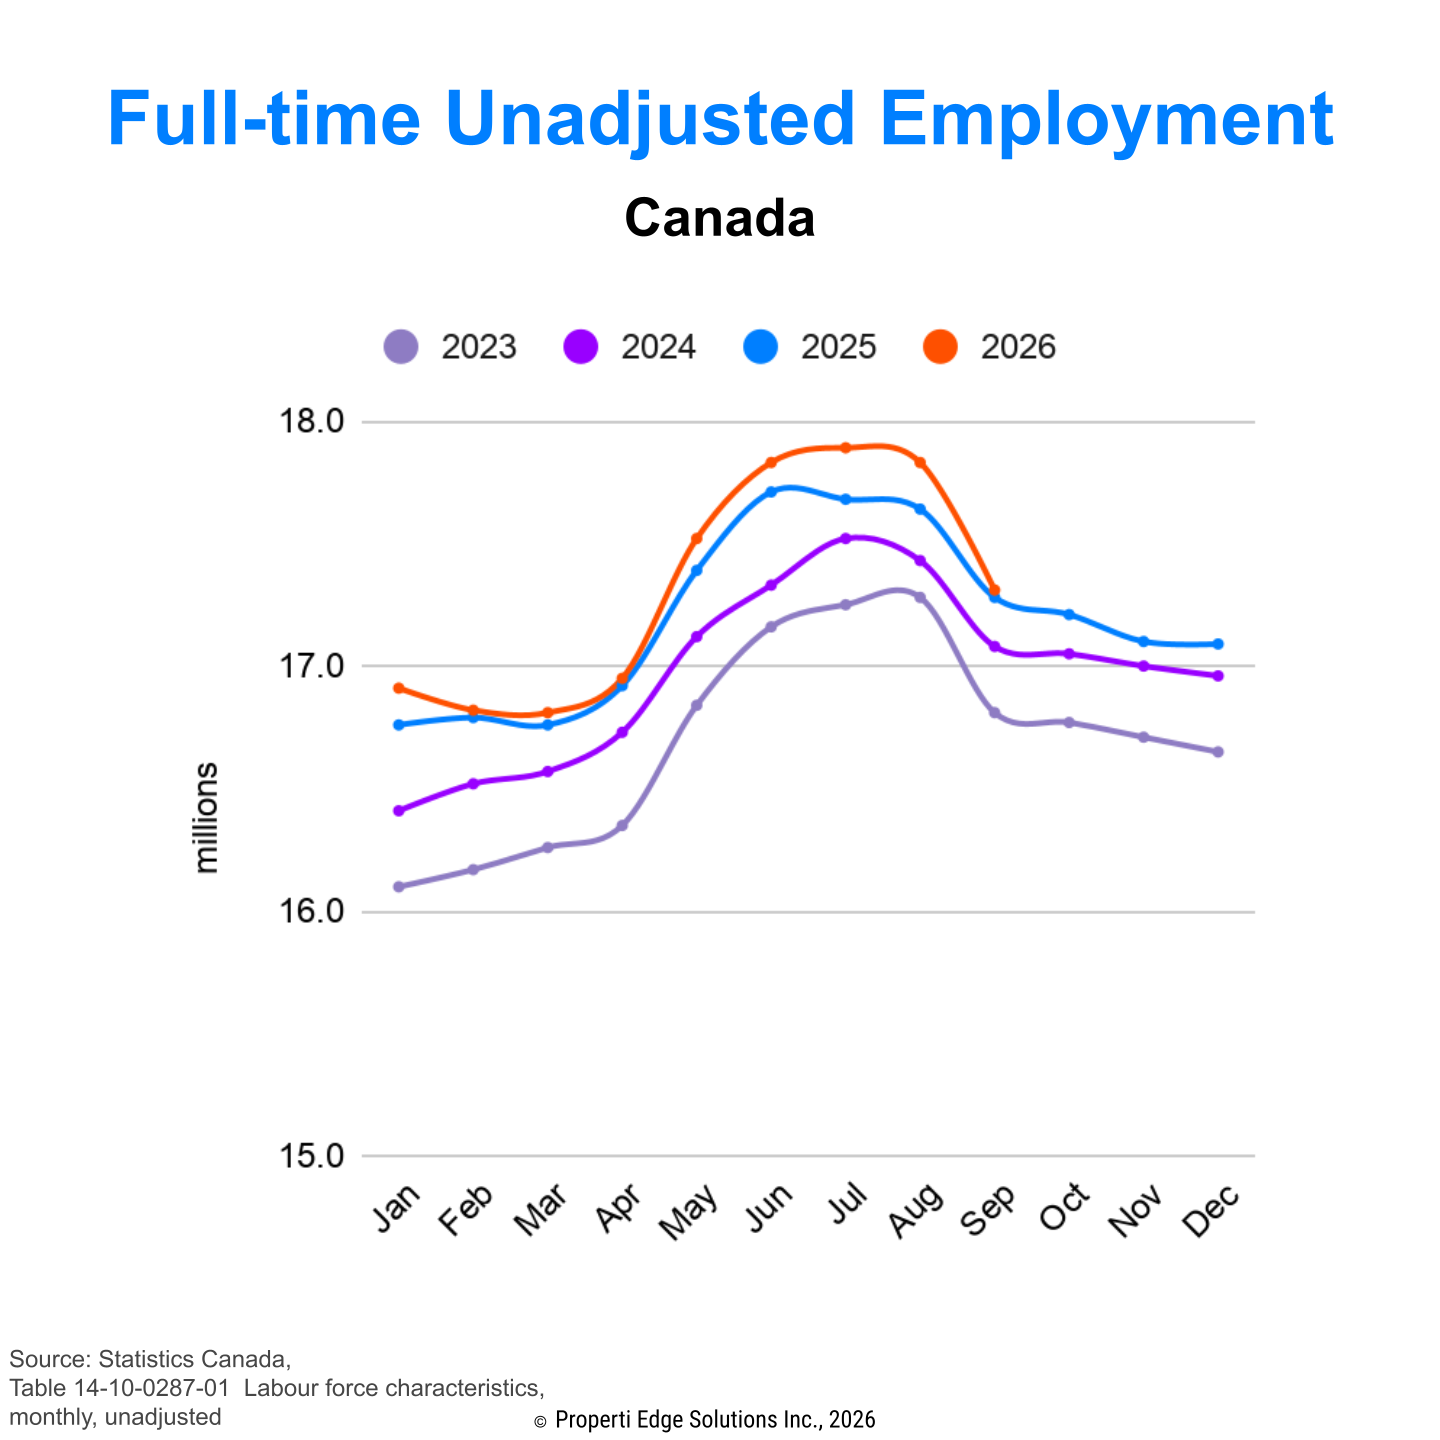
Showing national employment trends holding strong through 2026.
In recent remarks, Bank of Canada Senior Deputy Governor Carolyn Rogers outlined the scope and limitations of monetary policy regarding the real estate market:
Monetary Policy Scope: The central bank sets interest rates to maintain overall inflation near its 2% target rather than setting direct price targets for residential housing.
Supply-Side Limits: Rate policy influences housing demand, but cannot resolve structural supply constraints such as municipal permitting delays or construction capacity limits.
Policy Trade-offs: Raising policy rates moderates overall inflation but elevates construction financing costs; lowering rates offers short-term buyer relief but risks reigniting price demand before adequate supply is delivered.
Major Financial Institution Consensus Outlook
Major Canadian financial institutions highlight key structural themes governing the market trajectory:
RBC Economics: Emphasizes that population growth is stabilizing alongside revised immigration targets, with borrowing costs remaining the primary factor influencing near-term market sales velocity.
TD Economics: Notes that, relative to the 2010–2020 average, cumulative new housing completions have added more inventory than the market is accustomed to absorbing.
BMO Capital Markets: Points out that housing affordability metrics remain bound to qualifying mortgage rates, moderating price acceleration in high-density urban regions where home prices are highest.
UBS Economics: Even after prices have dropped significantly (20 to 30 percent in Toronto and 10 to 15 percent in Vancouver) they still believe these markets could fall further. They are still considered at “moderate risk.”
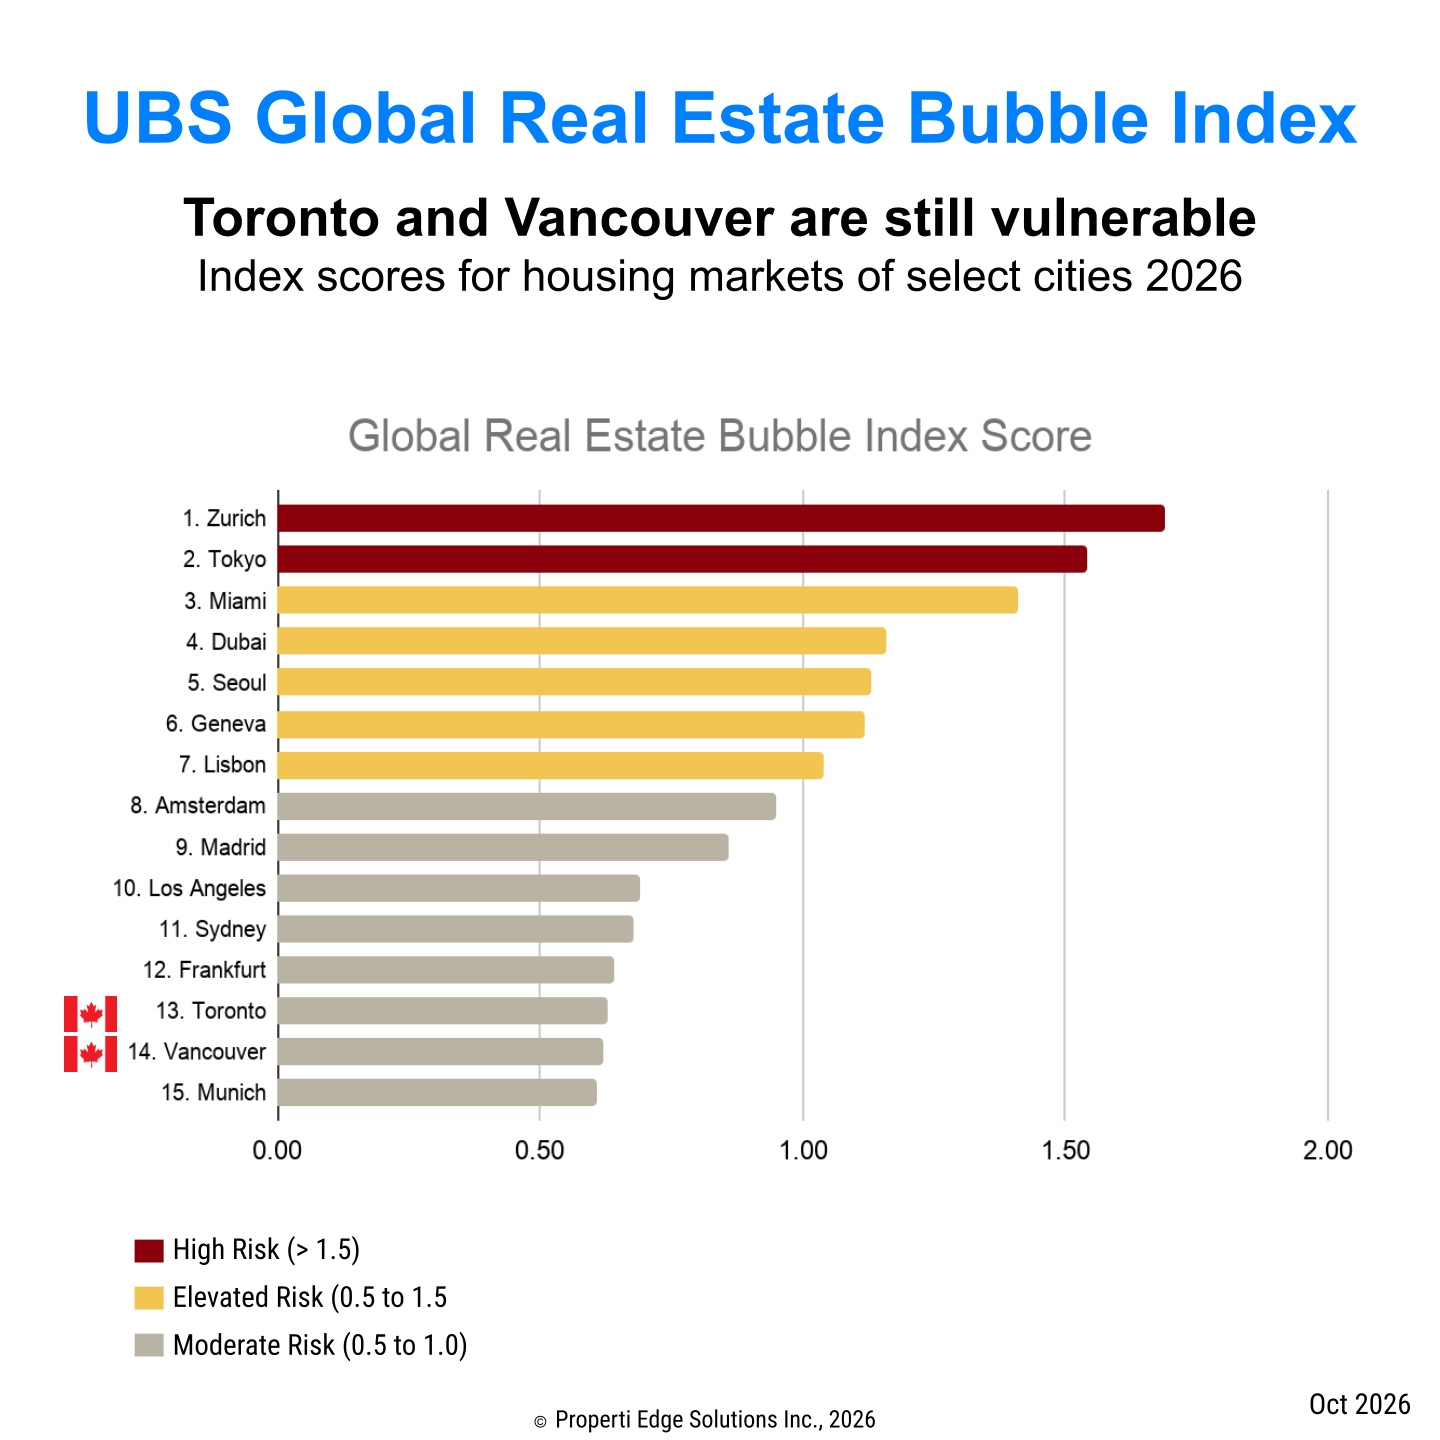
UBS has included Toronto and Vancouver in their Bubble Index and still considers them “moderate risk.”
Actionable Takeaways for Buyers and Sellers
For Homebuyers
Calculate Purchasing Power accurately: Base purchase budgets on qualifying stress test rates of 6.00% to 6.70% rather than advertised contract rates.
Leverage Regional Choice: Slower annual population growth in Ontario (+0.28%) and BC (+0.14%) combined with recent completions provides buyers with increased inventory selection.
For Homeowners and Sellers
Align Pricing with Current Rate Realities: Current mortgage rates in the 4.00% to 4.70% range reflect normal historical mid-range levels, requiring list prices aligned with real buyer qualification thresholds.
Rely on Underlying Fundamentals: National population growth (+189,425 year over year in Q3 2026) and steady employment continue to provide long-term support for Canadian real estate values.