
Canada's Housing Market: Rock Solid or Ready to Crack?
A Summary of Key Risks and What They Mean for Buyers and Sellers

Last Updated June 22, 2026.
HIGHLIGHTS
Prices are still sliding. The Teranet-National Bank composite fell for a sixth straight month in May 2026 and now sits about 8 percent below its 2022 peak. Toronto, Hamilton and London are each down roughly 20 percent or more from their highs.
The Bank of Canada is on hold. The policy rate is parked at 2.25 percent and the Bank expects to stay near there, but fixed mortgage rates have crept up since February, so the 2026 renewal wall is real, if smaller than once feared.
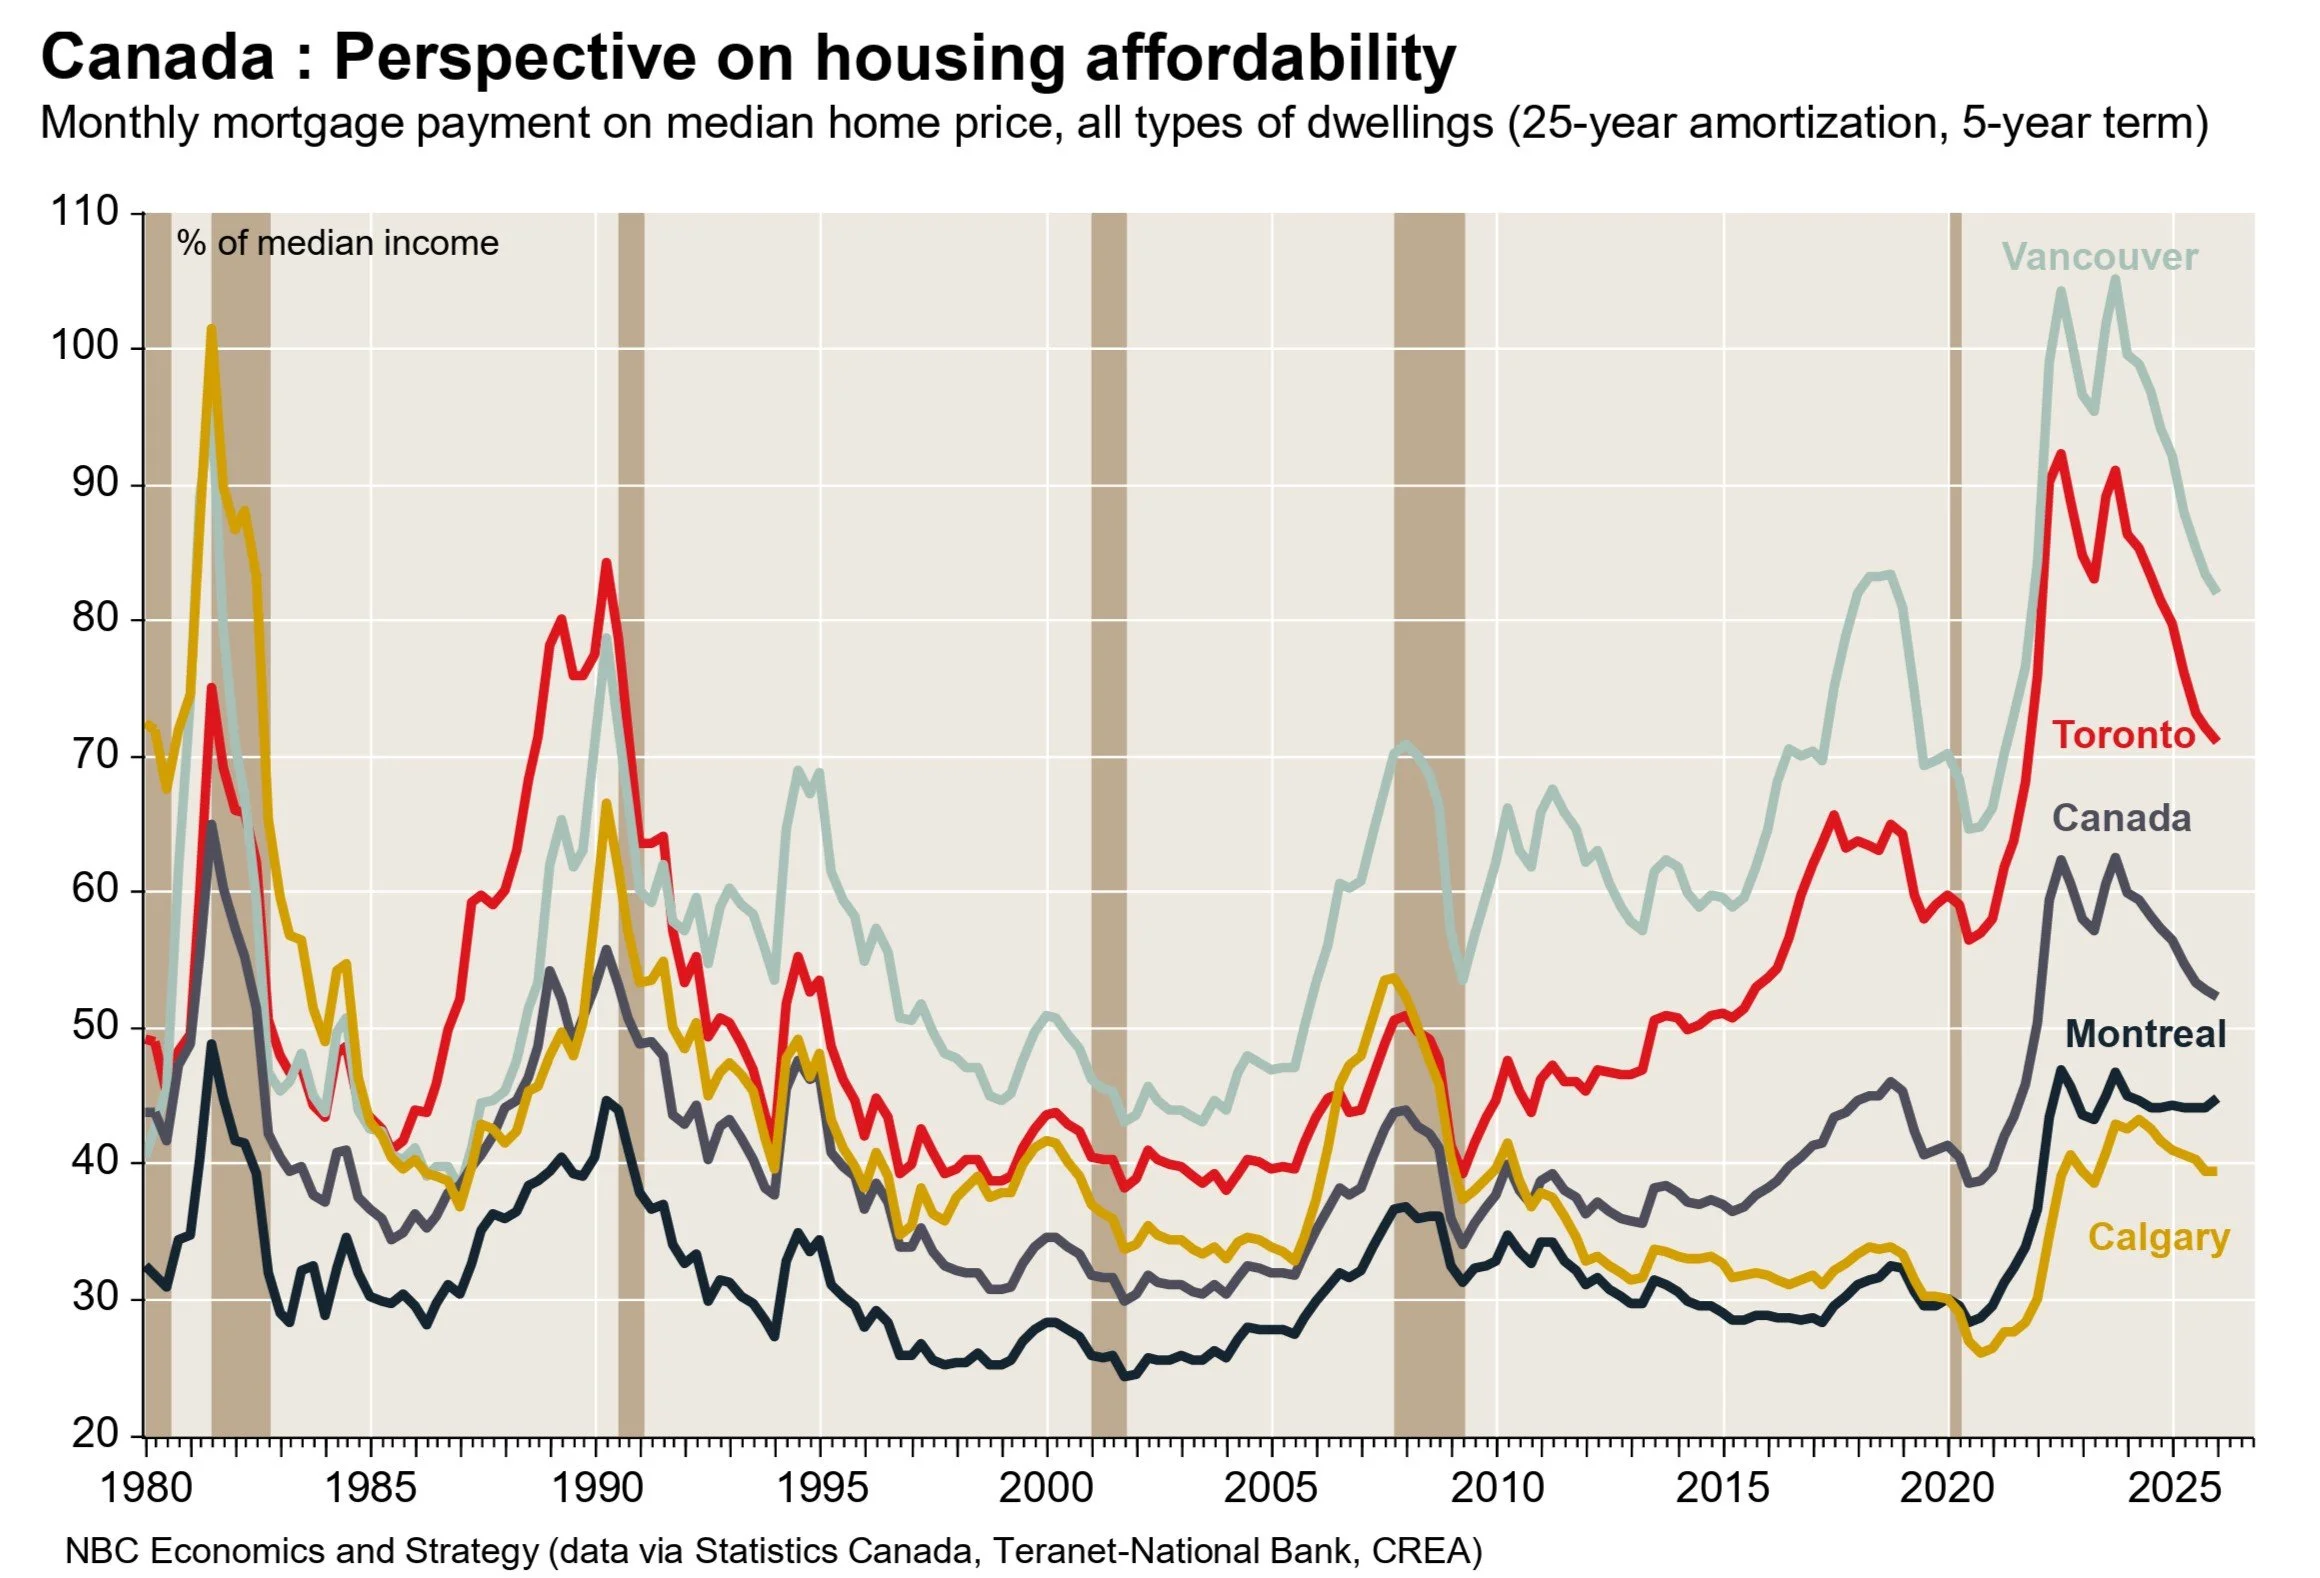
Affordability is the best in four years. The typical mortgage payment has eased to 52.3 percent of median income — a ninth consecutive quarterly improvement, the longest streak on record — though still well above the long-run norm of about 41 percent.
Vancouver is still the toughest market in the country. Even after the improvement, carrying a typical Vancouver home takes about 82 percent of median household income; a detached house takes 110 percent.
The relief is uneven. Affordability improved in Hamilton, Vancouver, Victoria, Toronto and Ottawa-Gatineau, but worsened in Montreal, Quebec City, Winnipeg and Edmonton, where prices kept climbing. Affordability has come from price reductions, not falling interest rates.
Insolvencies are at their highest since 2009. Filings have risen nearly 19 percent over the year, with homeowners an increasingly large share, even as households pay down credit-card debt and brace for renewals.
Condo supply keeps building. Listings are piling up in Toronto, Vancouver, Hamilton and London, and the bulk of newly built investor condos in Toronto are running cash-flow negative, pressure that could push still more units onto the market.
Sentiment has flipped from FOMO to fear. Buyers expect further price drops and are waiting; sellers remain anchored to peak valuations. The standoff is holding transaction volumes well below their ten-year average.
The demand engine is stalling. Federal immigration targets have been cut, and the three largest cities — Toronto, Montreal and Vancouver — are now losing population, removing a key prop under housing demand through 2026.
Investors have changed their math. The mindset has shifted from chasing appreciation to demanding cash flow, reshaping where housing demand shows up.
Summary: How to Use This Risk Map
Whether you're buying your first home, trading up, or selling a condo downtown, the state of your local market should drive your decision, not the national headlines.
This report maps risk across Canadian cities using three lenses: market fundamentals, price volatility, and affordability. Think of it as a weather forecast for real estate. It won't tell you exactly when the rain stops, but it will tell you when to carry an umbrella, when to hold, when to negotiate harder, and when to simply wait.
1. The Big Picture: A Market Losing Steam
The national picture is one of a market still grinding lower. The Teranet-National Bank Composite Index fell again in May 2026, its sixth straight monthly decline, down 1 percent on a seasonally adjusted basis. The composite now sits about 8 percent below its May 2022 peak and is off 4.3 percent over the past year.
Toronto dominates the national narrative by sheer size, down just over 8 percent year-over-year and more than 20 percent from its peak.
But the steepest percentage declines sit in the surrounding Ontario markets: Hamilton has fallen 9 percent in the past year and nearly 24 percent from its high, with London and Toronto each off about 20 percent from peak.
The divide across the country is stark. Prices are still setting records in Québec City, Montréal and Winnipeg even as Ontario and British Columbia wear the brunt of the correction.
Transaction volumes remain well below their ten-year average, though there are early signs of a resale rebound as affordability slowly improves. However, demand is held back, for now, by a shrinking population tailwind, fixed mortgage rates that have edged up since February, and uncertainty over the USMCA (US-Canada-Mexico Trade Agreement) renewal.
Teranet-National Bank Composite House Price Index™
Canadian metro home prices: where the market stands
| Metro | % m/m | % m/m, SA | % y/y | From peak | Peak date |
|---|---|---|---|---|---|
| Composite 11 | -0.60 | -0.19 | -3.62 | -7.53 | May 2022 |
| Calgary | +0.37 | +0.22 | -1.59 | -1.59 | Aug 2025 |
| Edmonton | -0.05 | -0.05 | +1.30 | -0.05 | Jul 2026 |
| Kelowna | -0.56 | +0.02 | -2.79 | -10.20 | Jul 2022 |
| Vancouver | -1.70 | -1.65 | -6.51 | -11.57 | Aug 2024 |
| Victoria | +0.05 | +0.55 | -2.36 | -6.45 | May 2022 |
| Hamilton | -1.86 | -0.31 | -6.24 | -22.37 | May 2022 |
| London | -0.06 | +0.47 | -4.64 | -19.66 | Apr 2022 |
| Ottawa-Gatineau | -0.33 | -0.53 | -2.16 | -3.98 | Jun 2022 |
| Toronto | -0.81 | +0.35 | -6.09 | -20.33 | May 2022 |
| Montréal | +1.49 | +0.29 | +4.07 | -0.42 | Jun 2026 |
Source: Teranet-National Bank House Price Index™, August 2026. SA = seasonally adjusted. “From peak” measures the change from each market’s record high to date.
Higher Mortgage Rates
The Bank of Canada has done most of its heavy lifting. After hiking aggressively through 2022 and 2023, it spent the next two years walking rates back down, and at its April 29, 2026 decision it held the policy rate at 2.25 percent. The Bank calls the current level the “stimulative end of neutral”. Governing Council signalled that, barring a shock, any further moves would be small.
That is a real shift from the affordability squeeze of 2023-24. Variable-rate borrowers have seen genuine relief and fixed rates have eased off their highs. But cheap money is not coming back. The Bank is now caught between two opposing risks: a fresh spike in oil and gasoline prices tied to the conflict in the Middle East, which is pushing inflation back toward 3 percent, and the threat of new US tariffs, which could just as easily push it to cut again. For buyers, the message is that the sub-2-percent mortgage is a relic, and rates are more likely to hover than to tumble.
While the prime rate has dropped significantly from the 2024 peak, it is still very high compared to the period from 2009 to 2021. Based on recent experience, it is possible that it will not return below 3 percent and instead behave more like it did before 2009.
High Household Debt Levels
The renewal wall is still coming, but it is no longer the cliff it once looked like. With the policy rate down to 2.25 percent, borrowers who locked in near record lows in 2020-21 still face a step up at renewal, just a gentler one than the 2023-24 forecasts feared. The Bank of Canada estimates that about 60 percent of all outstanding mortgages renew in 2025 or 2026, and roughly one-third of all mortgage holders will see their payments rise at renewal. The strain is concentrated among those who stretched furthest.
The demand side has also turned. The Bank of Canada now points to slower population growth as a structural drag on housing, alongside weaker investor appetite and a stubborn supply-demand imbalance. Federal immigration targets were cut starting in 2024, and the population tailwind that powered the last decade of price gains has faded.

2. Price Risk: Volatility and Overvaluation in Key Markets
Across major cities, home prices are still adjusting. Greater Toronto is down more than 20 percent from its 2022 peak, Hamilton and London nearly as much or more, while Ottawa has weathered the storm comparatively well. In British Columbia the picture is mixed: Vancouver's correction has been shallower than Ontario's, while Kelowna keeps grinding lower, weighed down by its small size and heavy investor exposure.
These moves are not random. Vancouver, Toronto, Victoria and Kelowna have all been flagged for high volatility, stretched affordability and signs of overvaluation, with prices long decoupled from local incomes. The gap is finally narrowing: National Bank's affordability monitor shows the typical mortgage payment has eased to 52.3 percent of median income. That is its lowest in four years and a ninth straight quarterly improvement, recently helped by rising wages rather than falling rates.
Even so, that figure sits well above the long-run average of roughly 41 percent, and the strain is most acute on the coast: in Vancouver, carrying a typical home still takes about 82 percent of median household income, and a detached house fully 110 percent. That level of financial strain is rarely sustainable.
A note of caution on what comes next. The affordability gains of the past two years were driven largely by seven straight quarterly rate cuts. That tailwind has stalled, fixed mortgage rates have turned higher since February so the improvement could pause, or reverse, in the months ahead even as prices soften. And the demand side is thinning: the three largest cities are now losing population, a genuine headwind for prices through 2026.
From an economic standpoint, the risk of further declines remains significant. Prices that outrun wages eventually correct. The key question is whether this correction stays slow and uneven or turns more sudden and broad-based.
3. The Condo Correction: From Glut to Balance
For two years the defining stress in this market was the glut of apartments in the big cities, with Toronto the epicentre. That story is now changing.
Through the depths of the correction, investors who bought presale units on the promise of rising rents and prices rushed to get out, and listings piled up. The math was brutal: according to Urbanation and CIBC, 81 percent of GTA condo investors carrying a mortgage were cash-flow negative in the first half of 2024 (rent no longer covered the mortgage, condo fees and property taxes), up from 77 percent in 2023 and just 52 percent in 2022. Ownership costs on newly completed units had jumped roughly 60 percent since 2020, more than double the rise in rents.
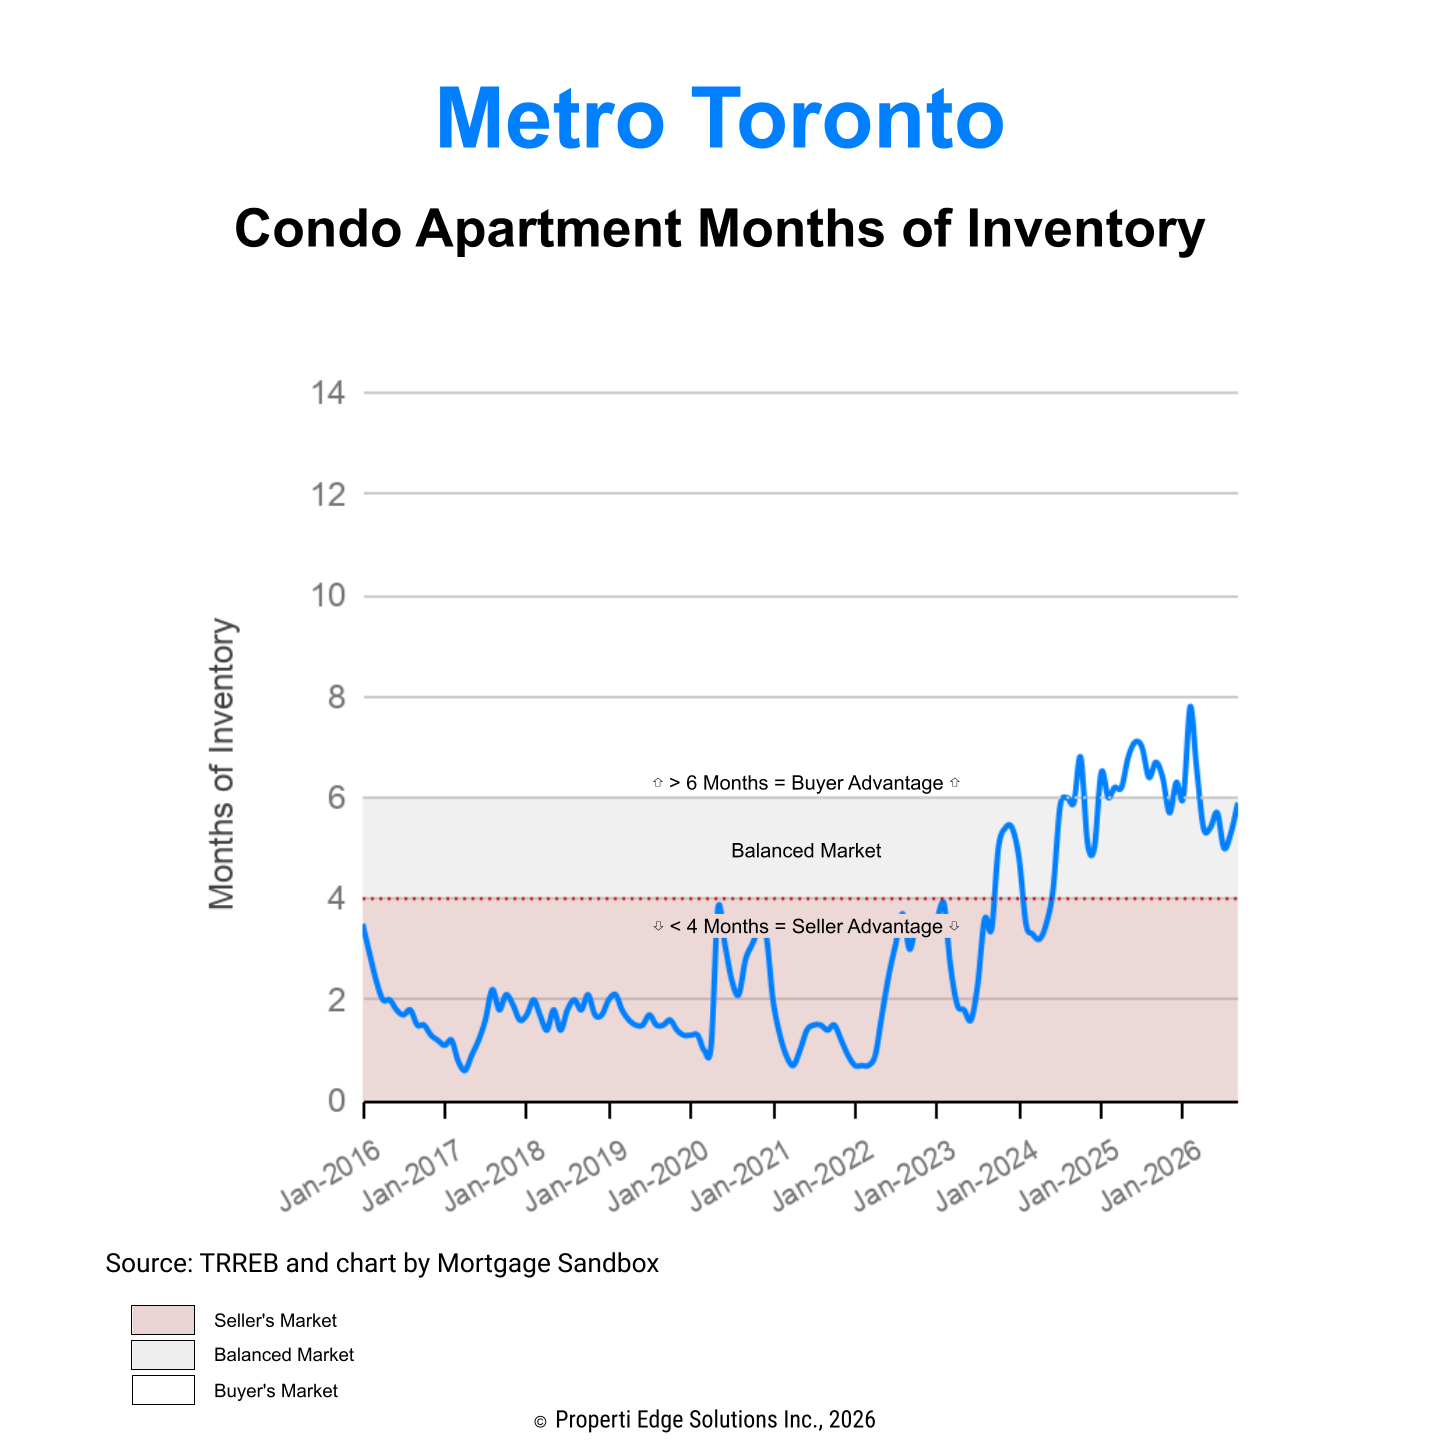
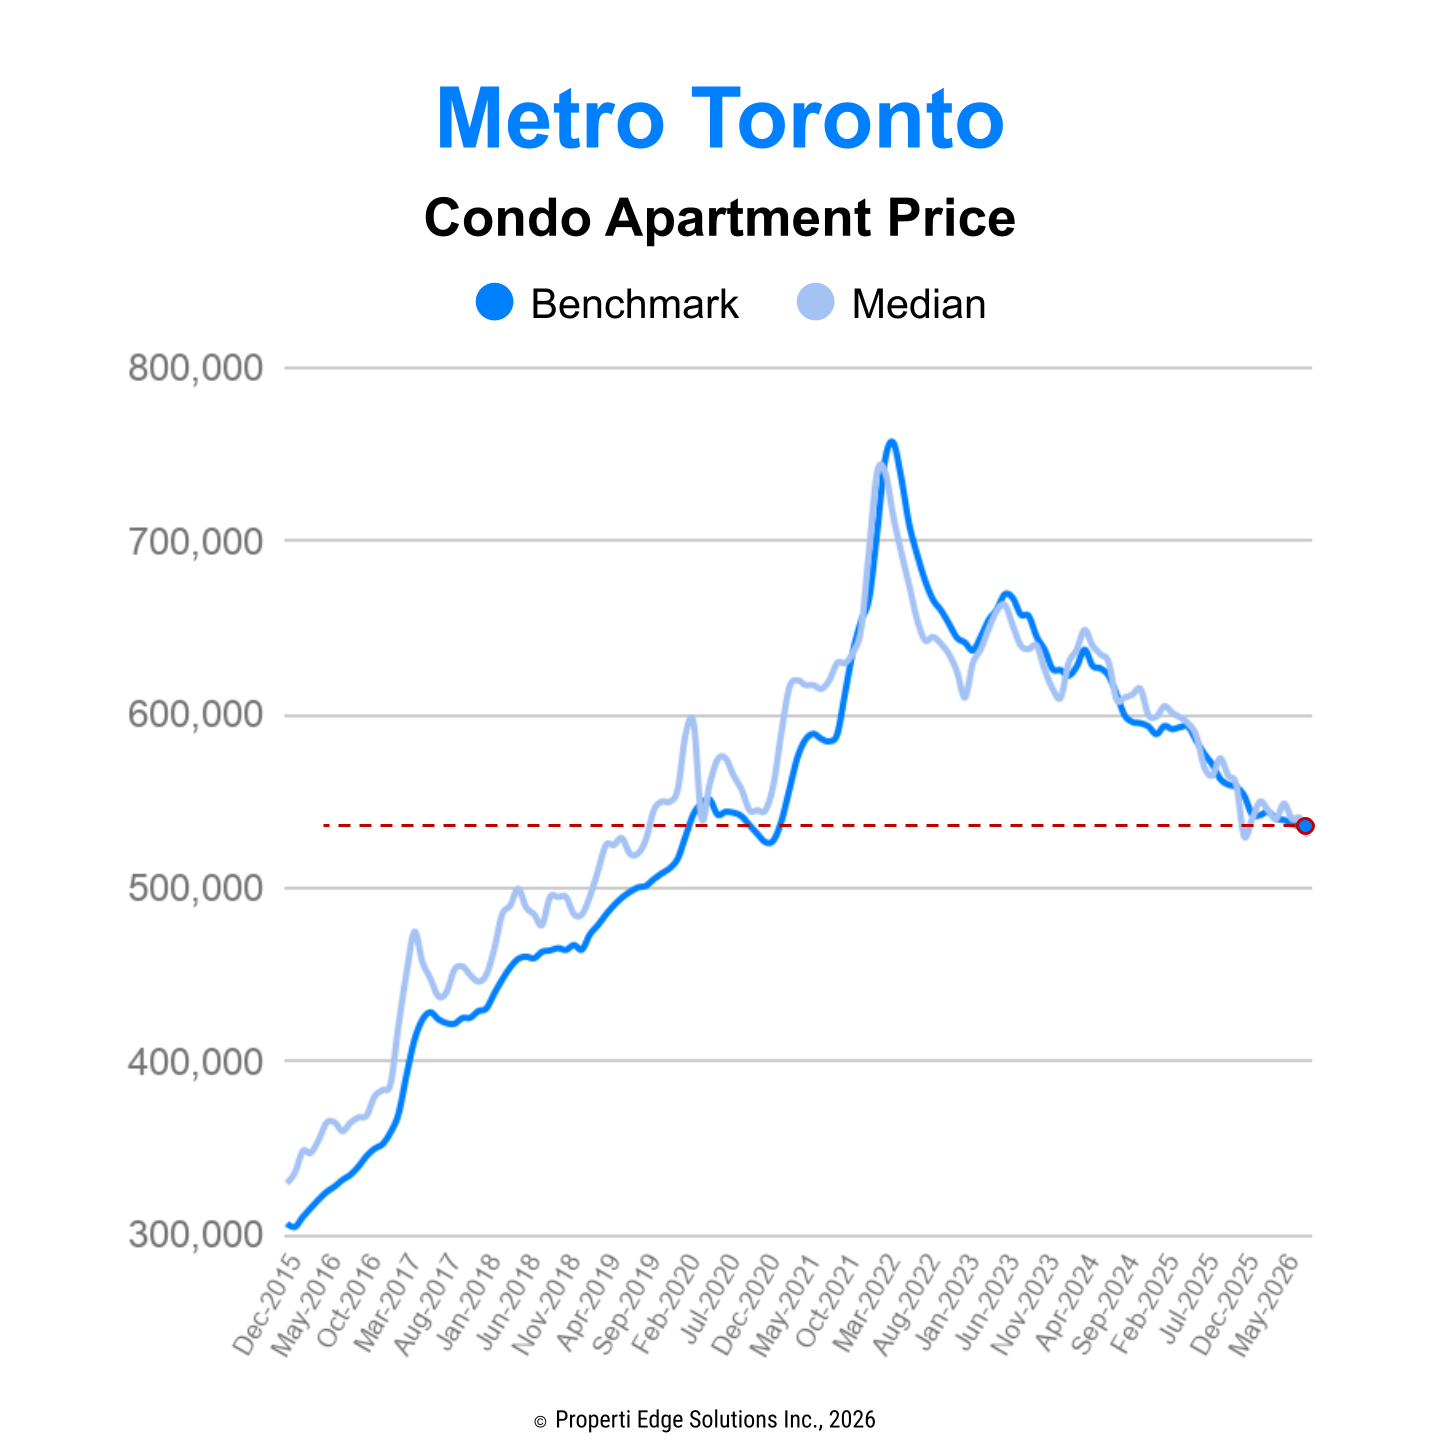
The price reset that followed has been steep, but it is now doing its job. The Metro Toronto benchmark condo sitswell below the 2022 peak and is still on a downward trend. It is a market still finding its floor rather than falling off a cliff. And the glut has cleared faster than expected: condo inventory has dropped from 7.1 months to 5.79 over the past year, active listings are down too, and the segment has shifted from a buyer's market back to a balanced one. Several months of inventory is not an oversupply; it is the normal breathing room of a functioning market.
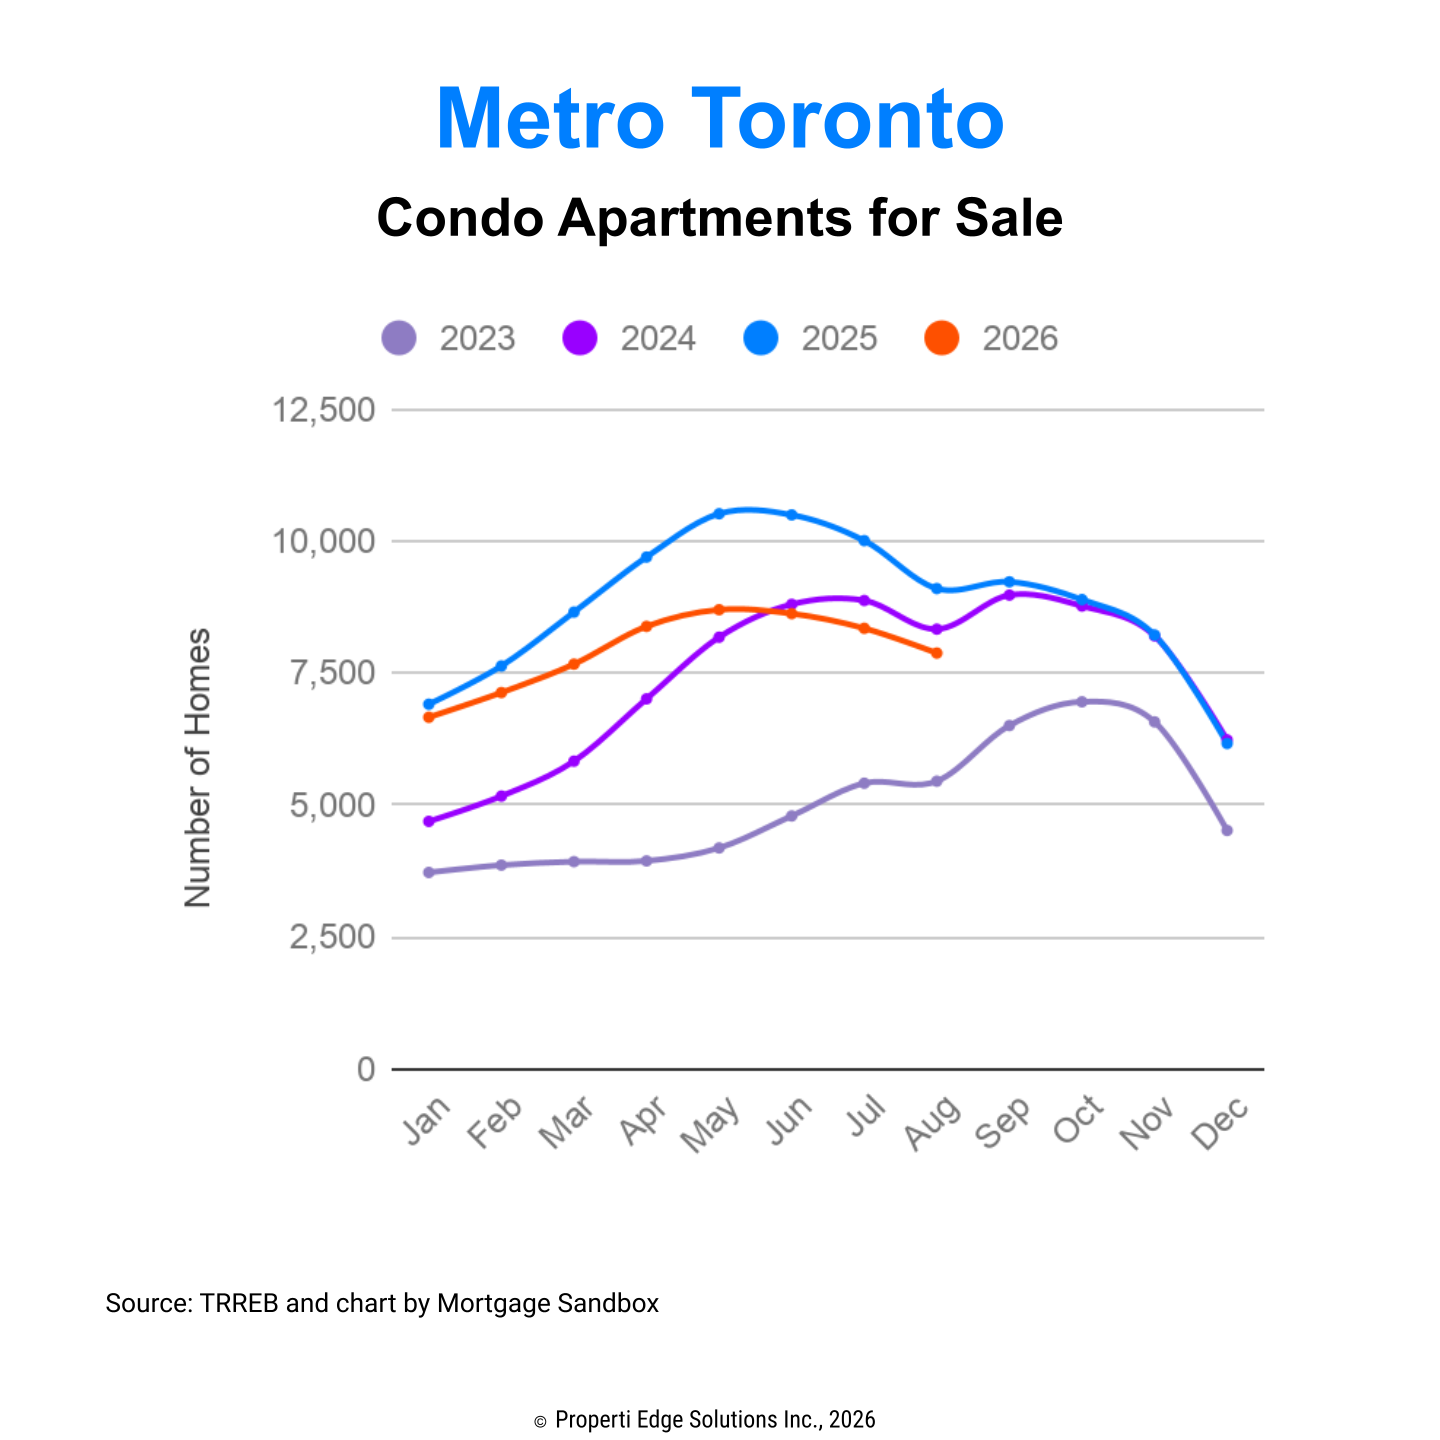
The deeper lesson is about imbalance. Toronto spent 2016 to 2022 in such an extreme shortage that prices ran to unsustainable levels; the correction has simply pulled them back toward fundamentals. There is good news buried in the pain. At roughly 5.6 times the local median income, the typical Toronto condo is now affordable for most buyers, a world away from the detached market down the street (more on that in the regional breakdown). Investors who bought at the very top remain underwater, but the broader condo market has absorbed much of the shock.
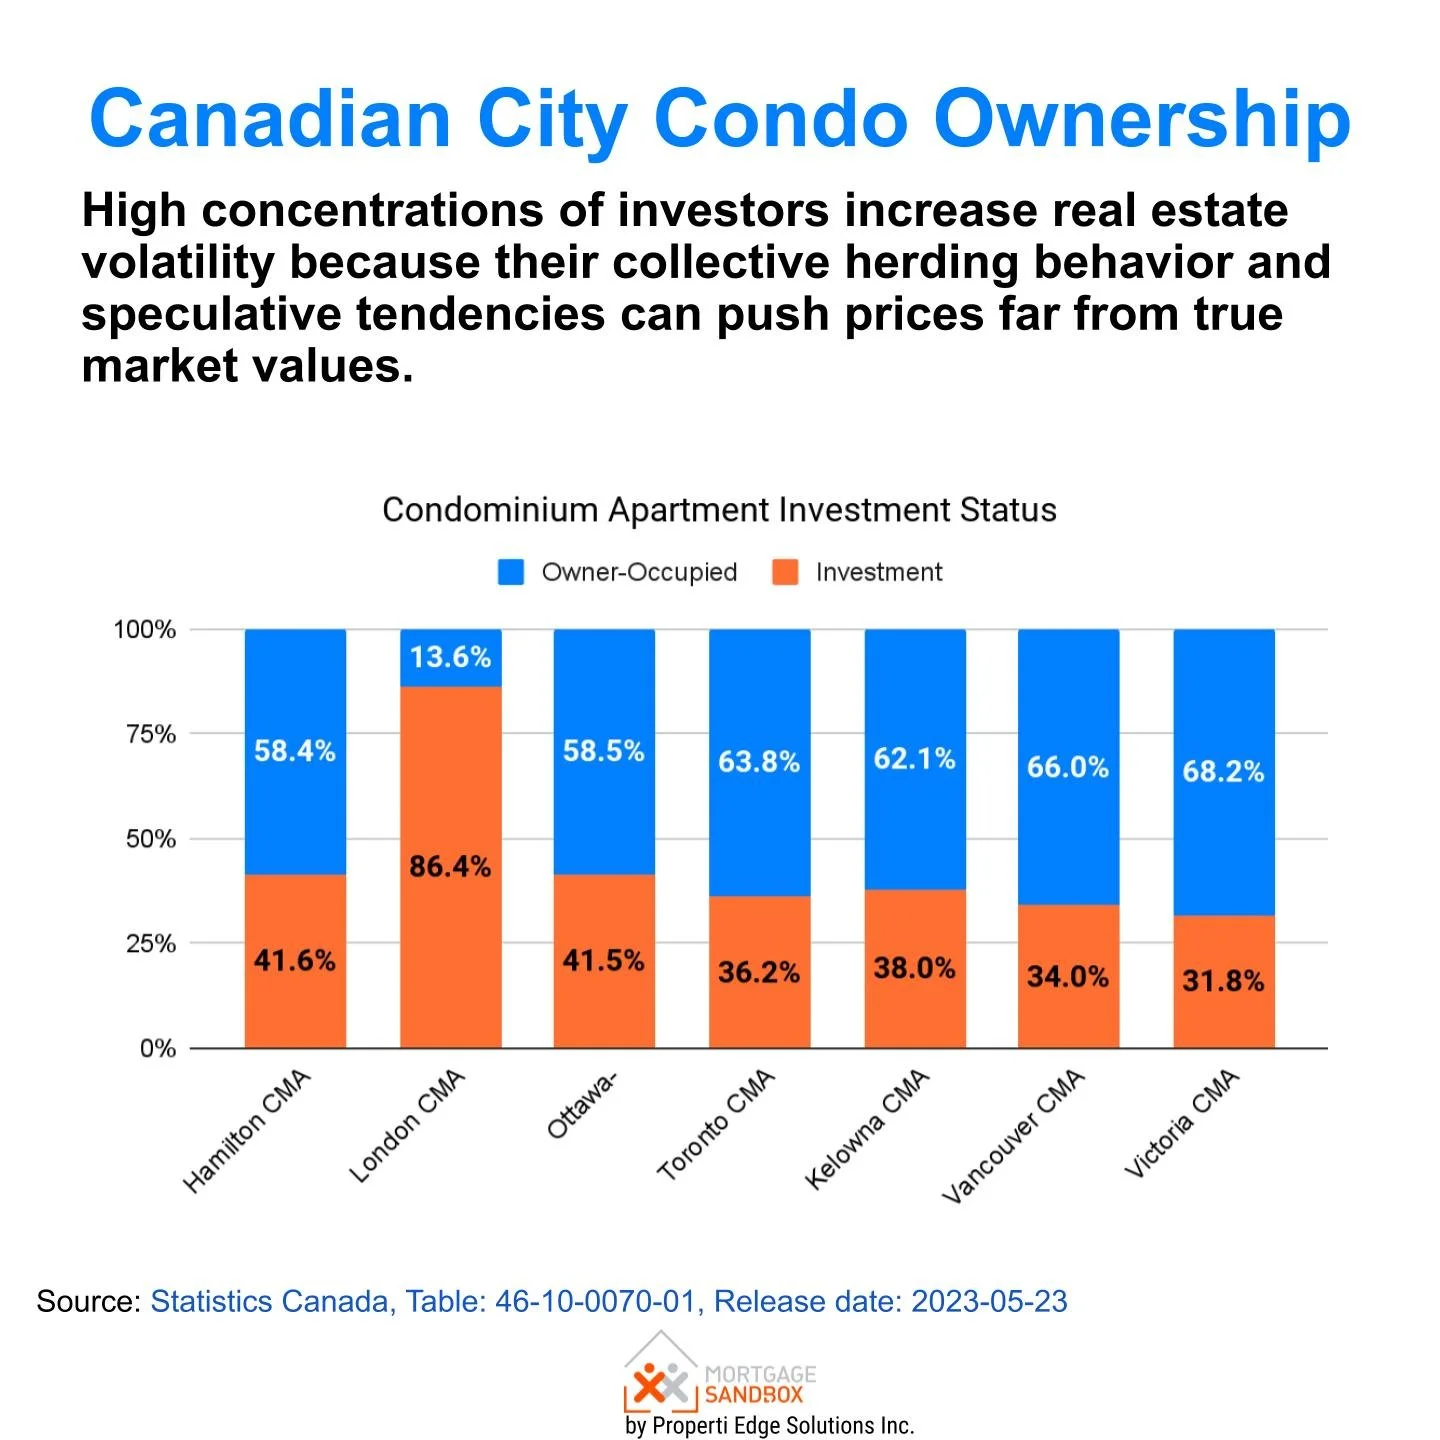
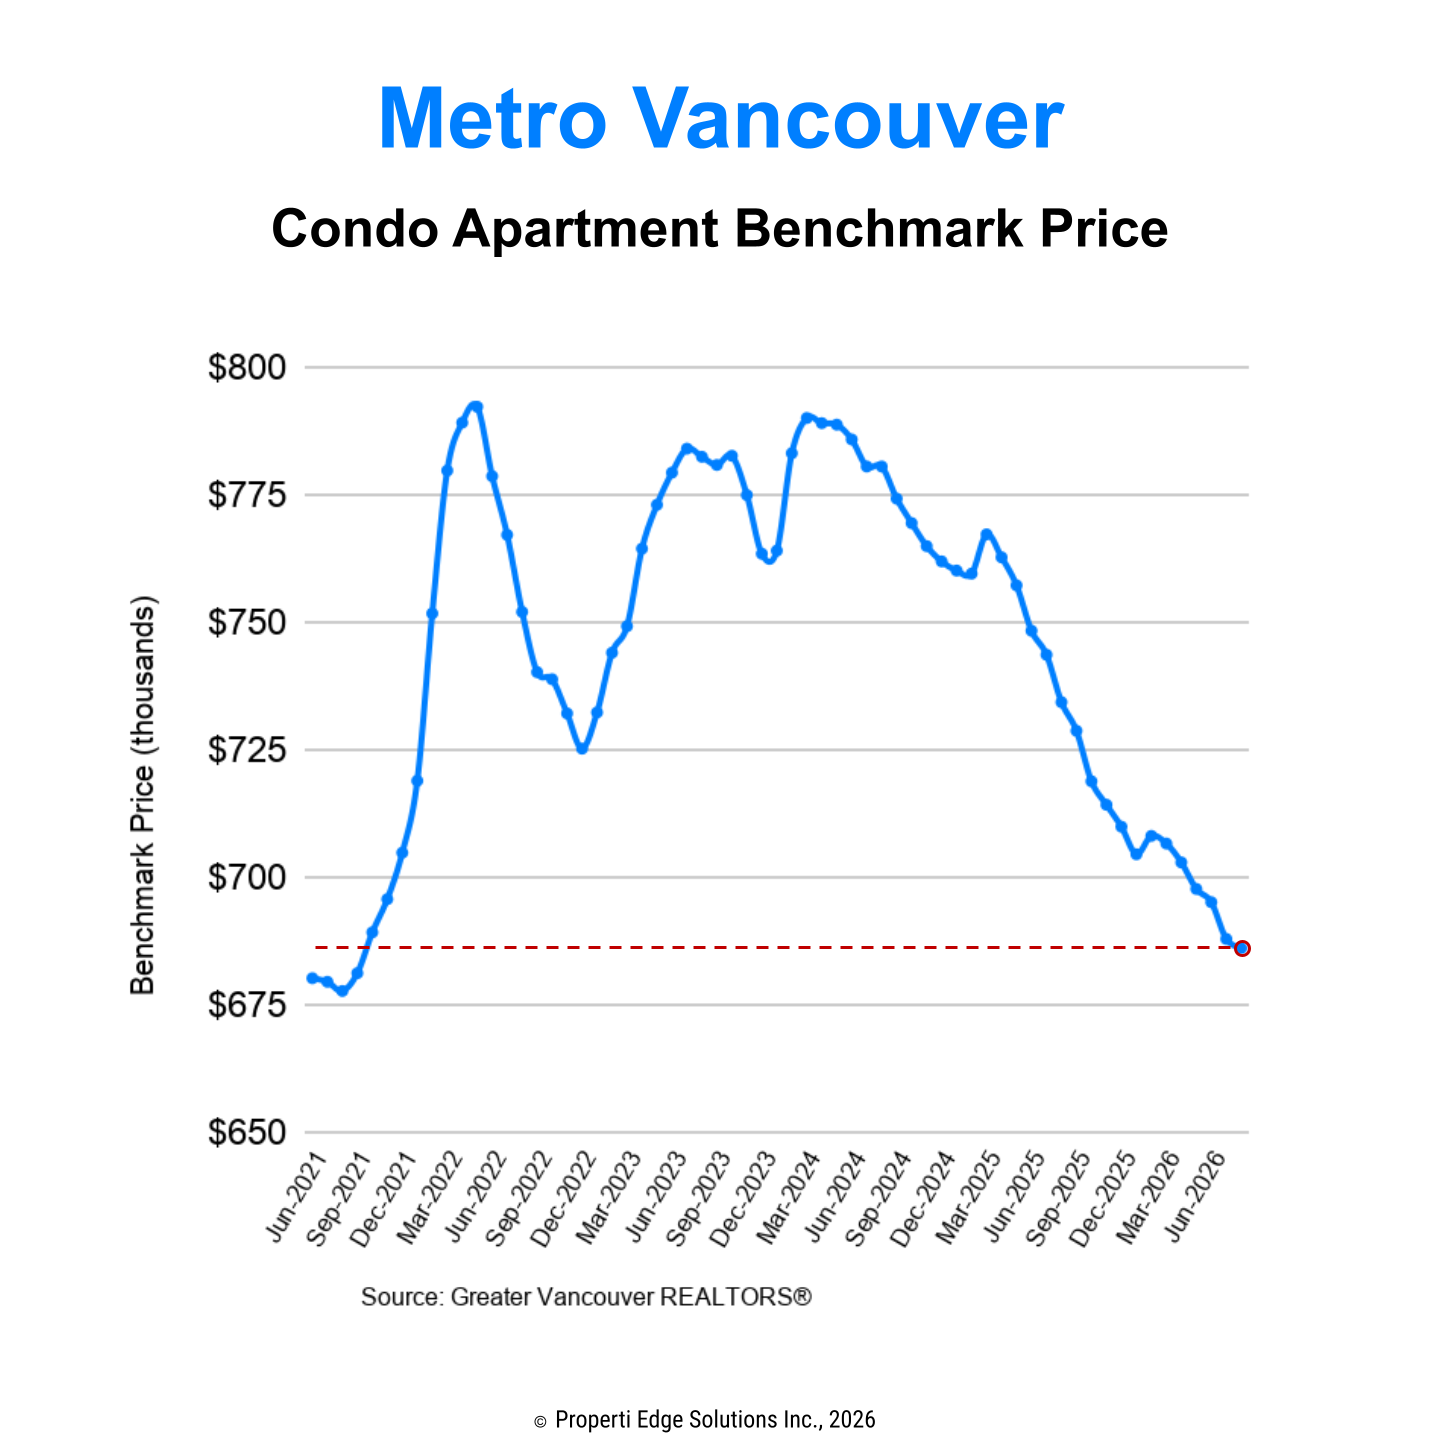
The picture is less settled elsewhere. In Vancouver, Hamilton and London, condo listings are still working through and resale values remain under pressure. And there is a twist worth watching: today's breathing room may be a timing illusion.
CMHC's Spring 2026 Housing Supply Report shows national housing starts rose 6 percent in 2025 to 259,000 units, but almost entirely on record rental construction, while condominium starts collapsed as presales dried up and unsold completed units piled to record highs. In the City of Toronto, purpose-built rental starts outnumbered new condos for the first time, and total Toronto starts fell to their lowest since 2009. Because the completions arriving now reflect projects launched years ago, and the future pipeline is thinning fast as condo cancellations mount, this short-term surplus could give way to renewed scarcity once demand returns.
4. The Debt Trap: Household Budgets Under Strain
Canada carries one of the highest household debt-to-income ratios in the developed world, and total consumer debt has now reached $2.66 trillion, up 3.8 percent over the year, according to Equifax Canada. Even with the Bank of Canada back at 2.25 percent, rates sit well above the ultra-low levels at which millions of households borrowed. The strain is showing up where it matters most, at the point of failure.
Insolvencies have climbed to their highest level since 2009, up nearly 19 percent year-over-year, and the pressure is falling increasingly on homeowners: the number of mortgage holders filing jumped more than 11 percent in a single quarter, and the great majority are choosing consumer proposals over outright bankruptcy. The hole is deeper than it used to be, too — the average insolvent mortgage holder now carries $82,400 in non-mortgage debt, up 19 percent in two years.
The stress is regional. Equifax data shows financial strain easing in Quebec, Nova Scotia, Saskatchewan and New Brunswick, but still rising in Ontario and British Columbia, the provinces carrying the biggest mortgages.
What is striking is how hard households are working to stay afloat. Canadians actually paid down non-mortgage debt in the first quarter, the first such decline in several quarters, and new credit-card borrowing fell to a four-year low. But discipline only stretches so far. The MNP Consumer Debt Index finds 43 percent of Canadians within $200 of being unable to meet their monthly obligations, and three in five say they need rates to come down. TransUnion's Q4 2025 Consumer Pulse adds nuance, almost two-thirds of Canadians say their finances are on plan or better, up seven points on the year, yet the strain falls hardest on the young: 39 percent of Gen Z expect to fall short on a bill, against 17 percent of baby boomers.
Renewals are the next pressure point. Though a shallower cliff than once feared. Five-year fixed-rate borrowers renewing in 2026 face the steepest jump, around 20 percent on average, yet the Bank of Canada does not expect a severe wave of distress: most were stress-tested at rates well above today's, many have earned raises since they last signed, and about half of those facing an increase could erase it by extending their amortization. Equifax, for its part, expects the renewal wave to ease toward the end of 2026. The danger is real but concentrated in the expensive cities where buyers borrowed most, and among households already stretched thin.
5. Market Sentiment: Fear Gives Way to Caution
The mood is steadier than it was a year ago. CMHC's 2026 Mortgage Consumer Survey shows recent buyers are noticeably less anxious: concerns during the buying process fell to 47 percent from 62 percent a year earlier, and worry about defaulting on a mortgage dropped to 39 percent from 53 percent. 81 percent still believe in property as a good long term investment, and 68 percent expect their home to gain value over the next year, though that optimism has cooled from a year ago.
Conviction has not translated into activity, however. Resale volumes remain well below their ten-year average as sidelined buyers wait for a clearer bottom and sellers stay anchored to peak valuations. That standoff keeps transactions subdued even as confidence quietly recovers. There is real pent-up demand here; in affordable, active markets like Alberta and Quebec prices should hold, while in pricier, slower British Columbia and Ontario there is still room to slip. The renewal pinch is real for those who already own, too: among renewers, 35 percent reported added financial pressure from rate changes, with payments up about $375 a month on average.
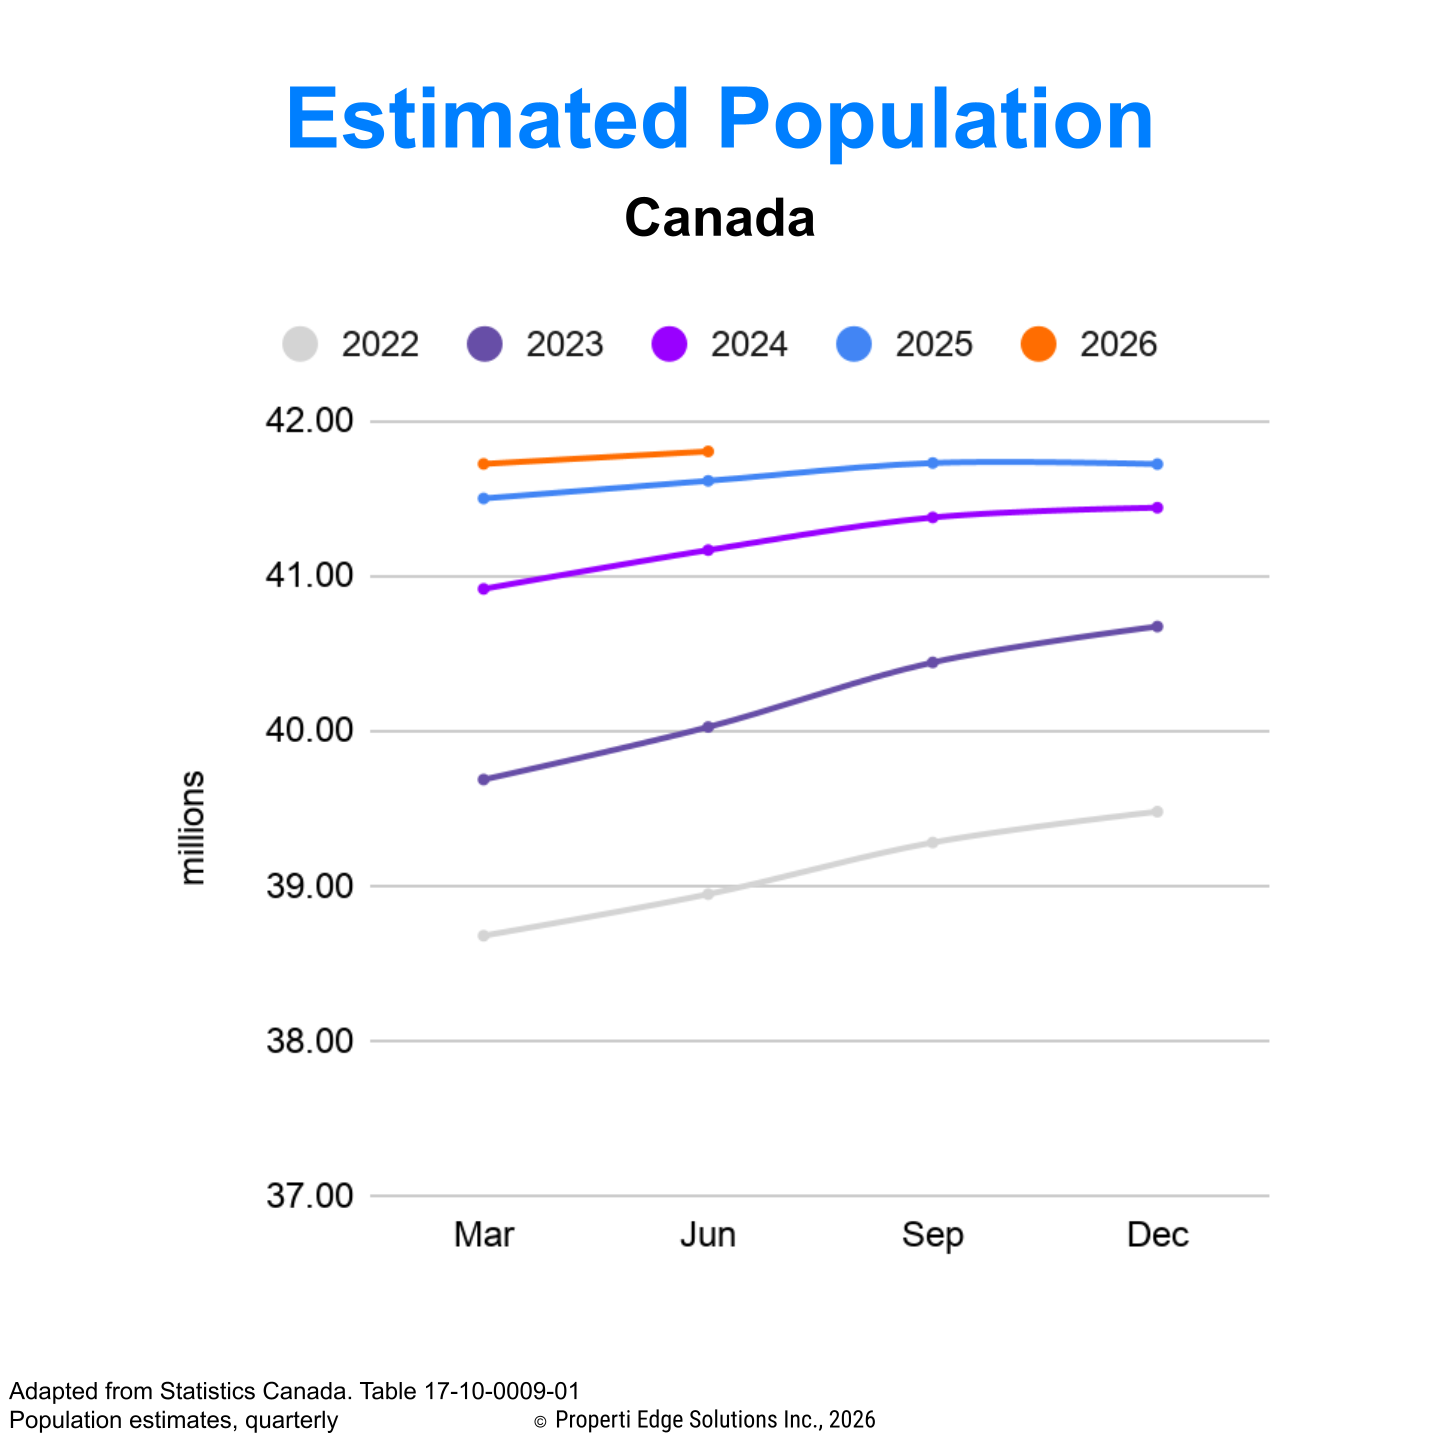
Government policy is reinforcing the adjustment. After two years of record-breaking growth, Ottawa's cuts to immigration and temporary-resident targets have thrown the demand engine into reverse. National population growth has swung from a peak above 400,000 people in a single quarter in 2023 to outright decline by late 2025, and Toronto and Vancouver have tipped into population loss. That removes a key source of housing demand just as a wave of new rental completions arrives.
On the supply side, Ottawa is leaning hard on construction. Build Canada Homes — the federal housing agency launched in late 2025 and now being made a permanent Crown corporation — anchors the effort, with $25 billion in debt financing and $1 billion in equity earmarked for prefabricated and modular builders, part of Prime Minister Carney's pledge to double residential construction to 500,000 homes a year over the next decade.
The agency has begun moving from planning to construction on six federal "Direct Build" sites, Toronto among them. The strategy pairs supply-side measures (public-land builds, prefab demand, lower development charges) with demand-side ones such as GST relief for first-time buyers of new homes. The near-term price effect, though, is easy to overstate: the Parliamentary Budget Officer estimates Build Canada Homes will itself deliver only about 26,000 of the roughly 690,000 homes the country needs by 2030.
The larger bet is industrial. Using government demand to stand up a Canadian prefab sector that, over time, builds faster and cheaper. If it works, the long-run pressure on prices points flat to lower; the short-run effect is modest.
6. Regional Breakdown: Risk Profiles by City
The latest Properti Edge analysis scores Canada's major metros on six risk dimensions: market balance, balance trend, price volatility, over-valuation, new supply and market siz. It does so separately for houses and for apartments, because the two segments can sit at opposite ends of the risk spectrum within the same city.

Canada Major City | Detached House Market Risk Assessment

Canada Major City | Condominium Apartment Market Risk Assessment
The two views tell different stories — and that contrast is the point. On the house side, Victoria carries the only higher-risk score, while Calgary and Montreal sit at the lower-risk end and the rest, Toronto and Vancouver included, fall in the moderate middle.
Switch to apartments and the map redraws itself: London jumps to higher risk, most markets hold at moderate, and Toronto drops to lower risk, the very city whose detached segment still looks stretched. Risk lives at the segment level, in other words, and a single citywide verdict can mislead.
For the big two, Toronto and Vancouver, the one persistent red flag on the house side is over-valuation, which is where the global indices land too.
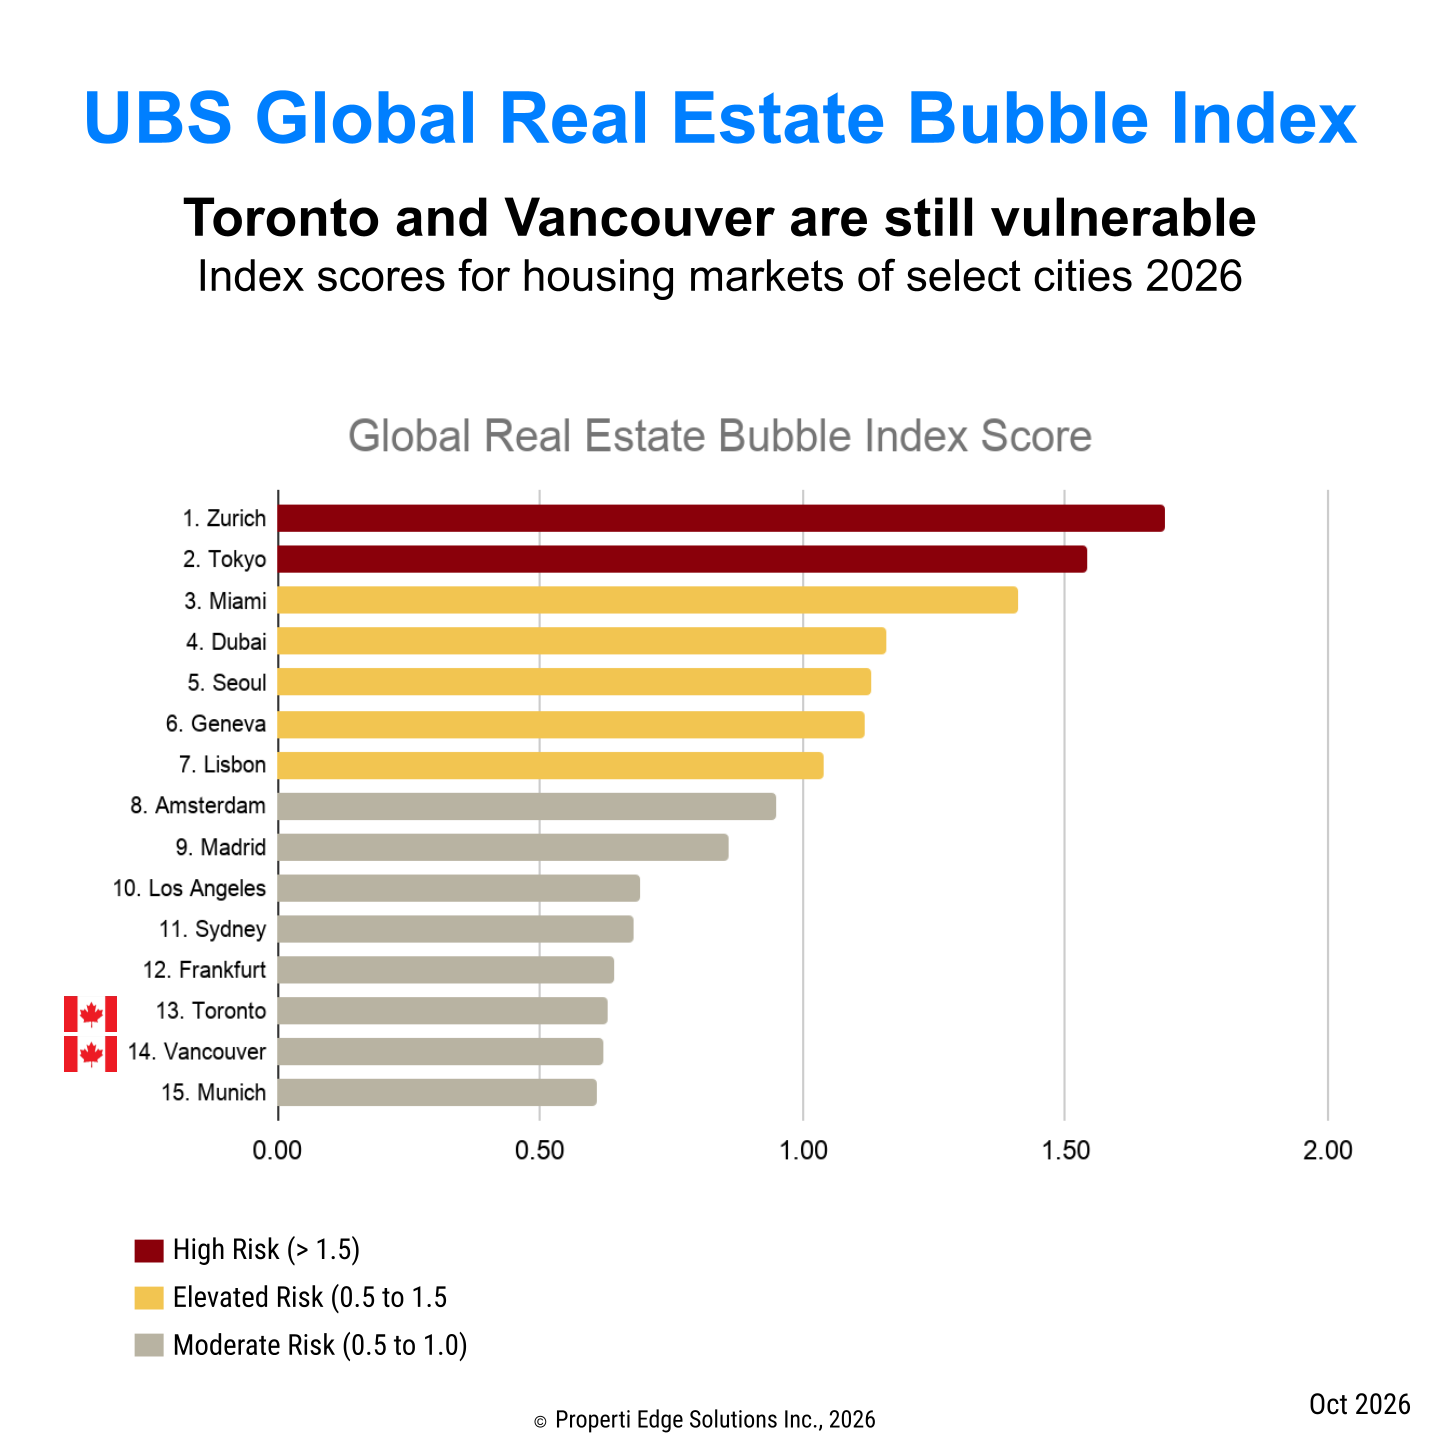
The international scorecards now tell a more nuanced story. On the UBS Global Real Estate Bubble Index, Toronto and Vancouver have actually slipped to the moderate-risk group.
Miami, Tokyo and Zurich now lead because the price correction has pulled valuations back toward fundamentals and taken the froth off the bubble signal. But that does not mean these markets are cheap.
Demographia's 2026 survey still ranks Vancouver among the least affordable cities on earth, with a median home costing 10.8 times median household income, its "impossibly unaffordable" tier, and Toronto close behind at 7.6 times, deep in "severely unaffordable" territory. The bubble has deflated; the affordability gap has not.
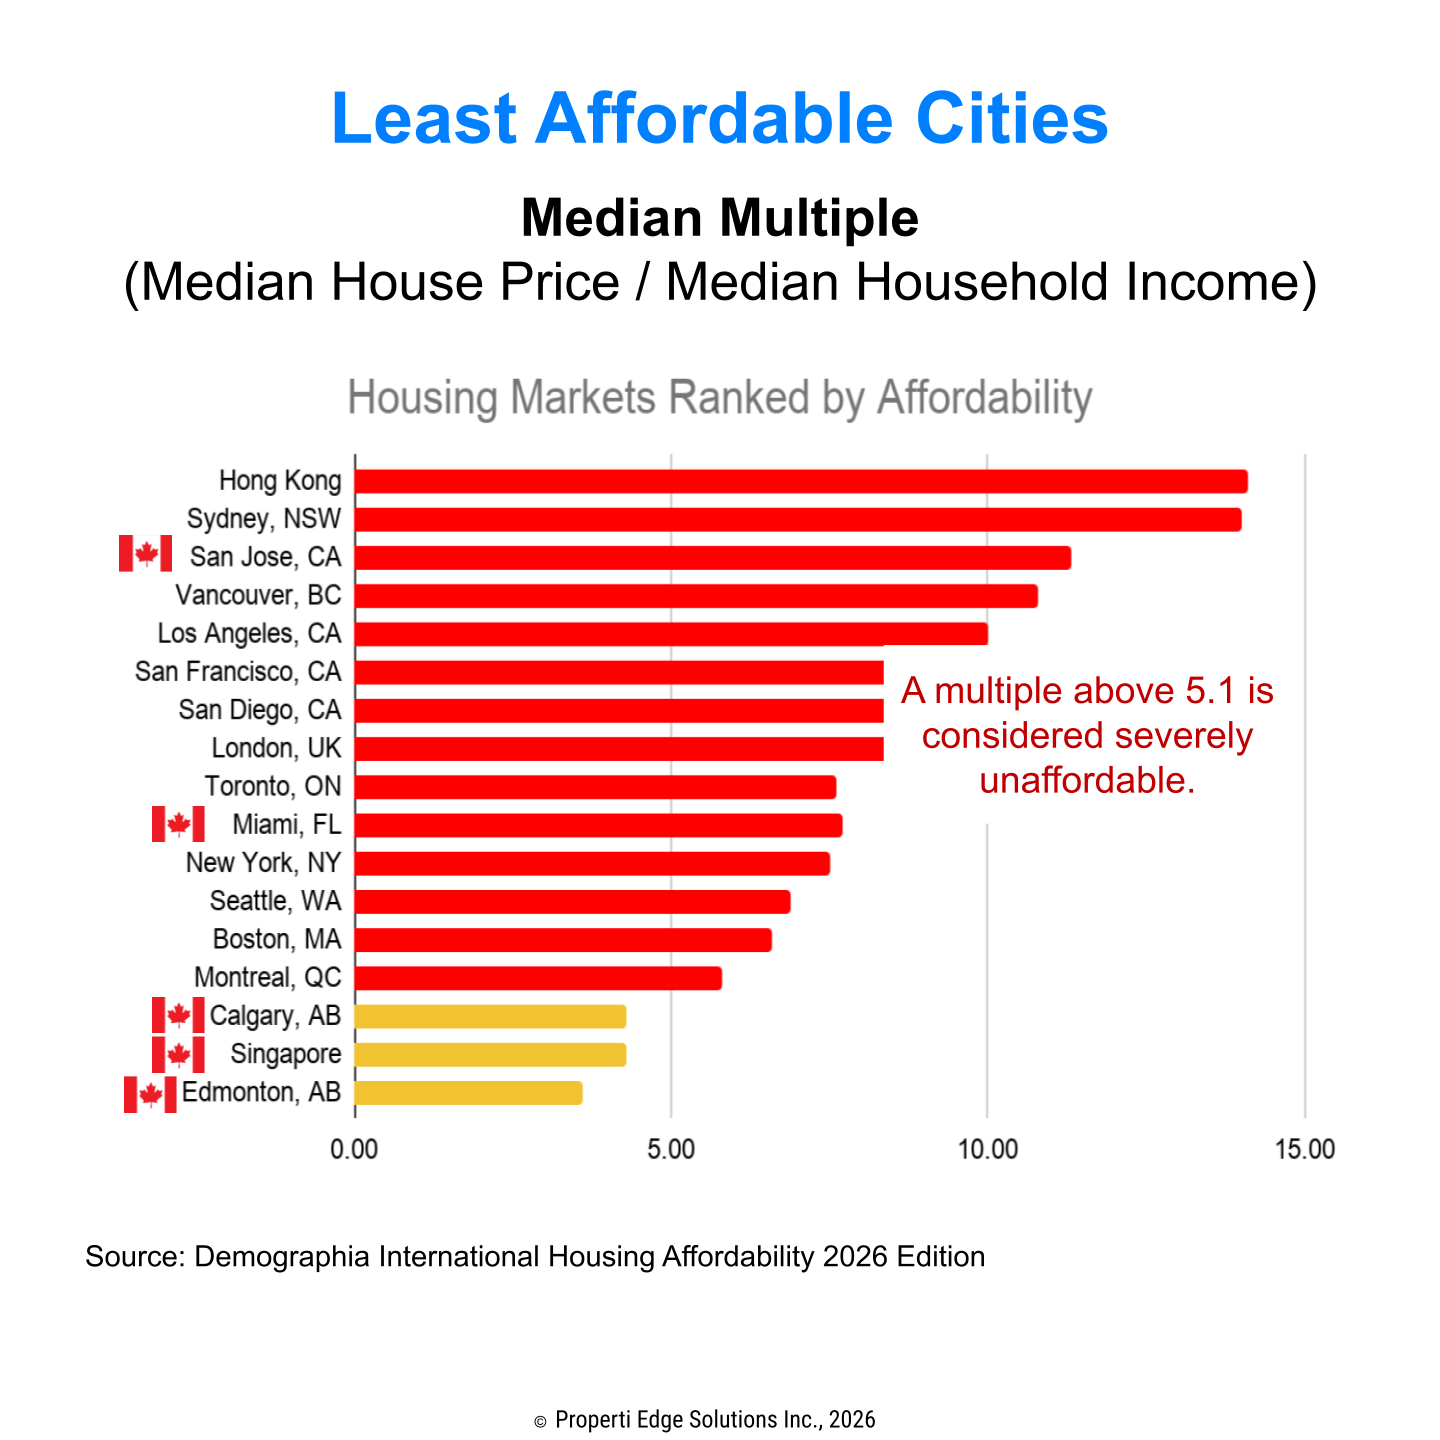
The math behind Toronto's split is stark. Its detached segment remains firmly in bubble territory: at a benchmark of roughly $1.24 million, the typical detached home costs 12.8 times the local median household income. That’s far beyond the four-to-six times generally considered sustainable, and that is after a 6 percent decline over the past year. The condo segment tells the opposite story. At about 5.6 times income, the typical Toronto condo now sits within reach of most buyers. One city, in short, holds both the most overvalued and one of the more reasonably priced segments in the country, which is exactly why the two risk charts above diverge
What This Means for You
If you're a first-time buyer in B.C. or Ontario, patience may pay off. The correction is still underway and prices are unlikely to snap back quickly. But don't bank on rate cuts to rescue affordability: the Bank of Canada expects to hold near current levels, and its next move is genuinely two-sided — higher oil could force a hike, while new US tariffs could prompt a cut. Plan around the rate you can get today, not one you're hoping for.
Sellers should be strategic. If you plan to sell within three years, listing sooner rather than later may beat waiting for a rebound that could take years, especially in pricier markets. If your retirement or next move depends on unlocking equity, talk to a real estate agent and a financial advisor about timing. The ideal, sell into a seller's market and buy into a buyer's, rarely lines up perfectly, but you can exploit imbalances by selling where inventory is tight and buying where it's loose.
Investors should tread carefully. Buying pre-construction on the hope of quick appreciation is no longer a safe bet — the cash-flow math has turned sharply negative. Make cash flow the priority: look for units that can carry themselves at today's rents and rates, seek stable rental demand and modest price-to-income ratios, and avoid pockets with heavy investor turnover. Focus on long-term fundamentals, not speculative gains.
A Final Word
Canada's housing market has absorbed a significant shock, and the full impact has yet to play out. As renewals roll through 2026 and buyer sentiment stays subdued, further downward pressure on prices is likely. Conditions vary by city and property type, but the through-line is the same: affordability has overtaken scarcity as the dominant force.
In this kind of market, prudence beats timing. Focus on your household budget, the fundamentals of your local market, and the utility of the property itself. Whether you're buying, selling, or investing, the best time to act is when your finances are ready, not when the headlines suggest a trend.
Before you decide, revisit your city's risk profile. In a volatile market, clear-eyed strategy and financial discipline are the most valuable assets you can bring to the table.
Like this post? Like us on Facebook for the next one in your feed.